 Facebook
 X
X
 Pinterest
 Copy Link
How’s the Market? An Annual Review of Seattle Area Real Estate

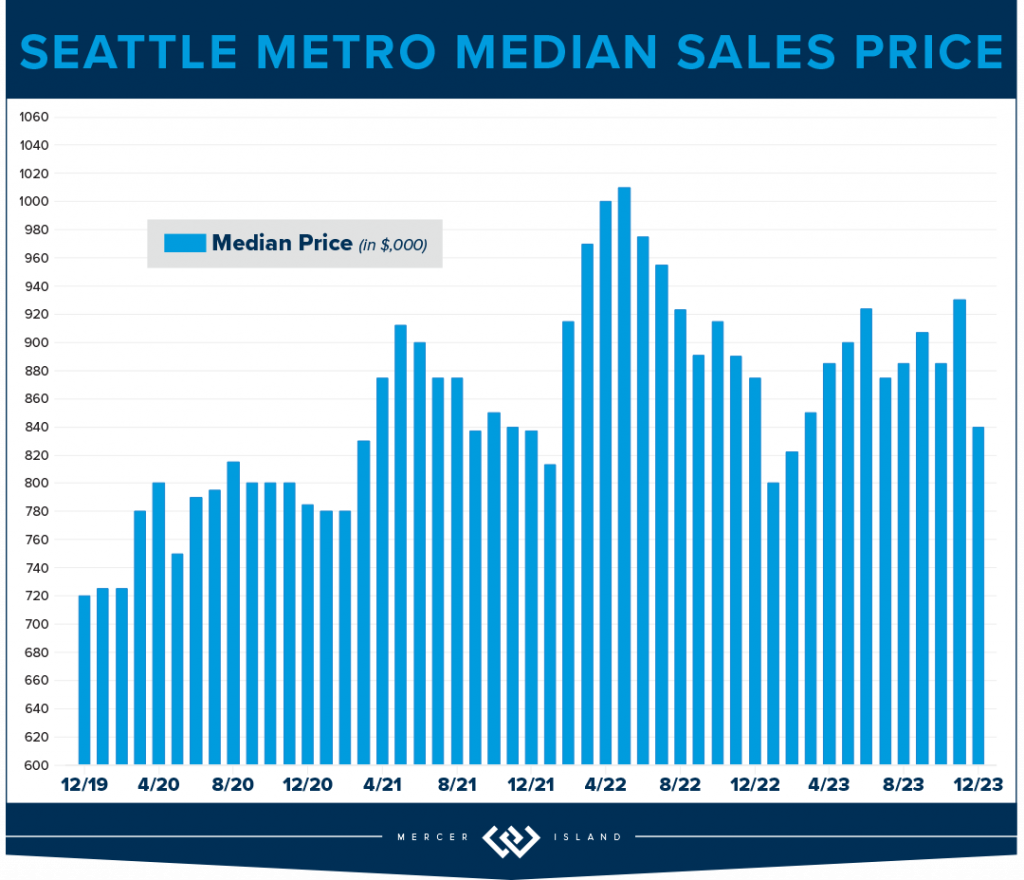
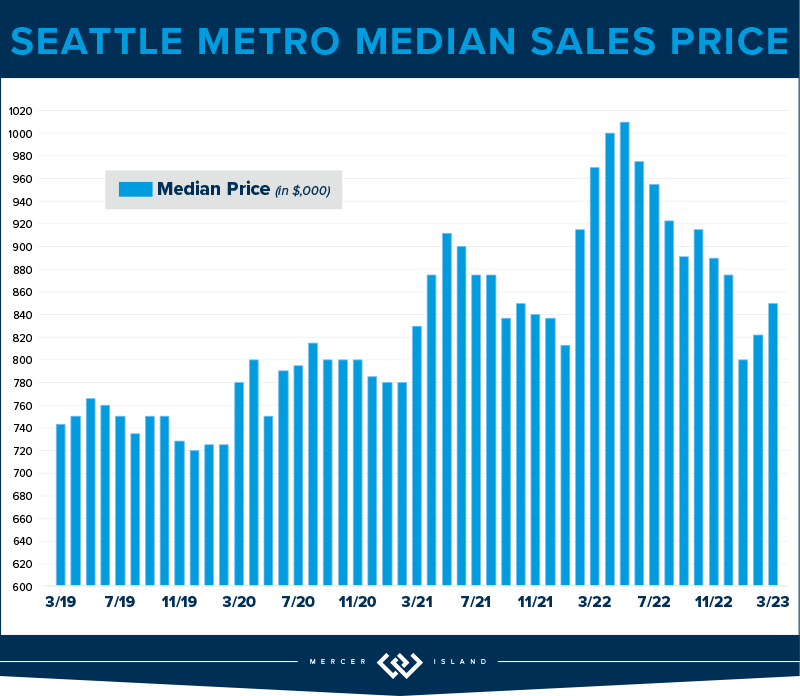
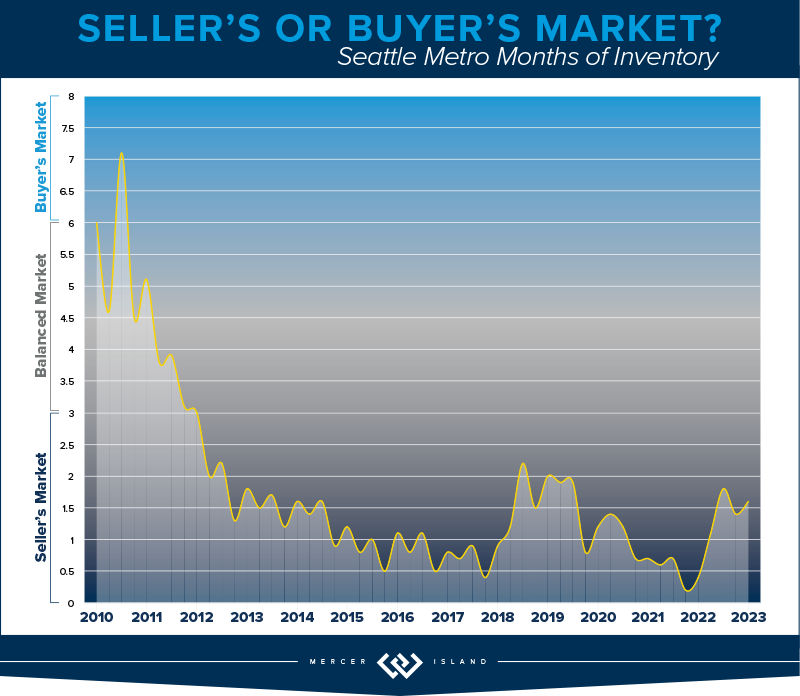
Median home sales prices across the region saw a year-over-year dip compared to 2022, with prices settling just above their 2021 levels. That being said, most homes still sold within the first 10 days on the market and either at or above the listing price. Today’s higher rates, in concert with constricted inventory, have slowed the total number of sales. Should rates ease like experts are predicting, however, we will see more people enter the market and hopefully more listings will follow. (Read more about that in our full 2024 forecast).
Click or scroll down to find your area report:
Seattle | Eastside | Mercer Island | Condos | Waterfront
SEATTLE
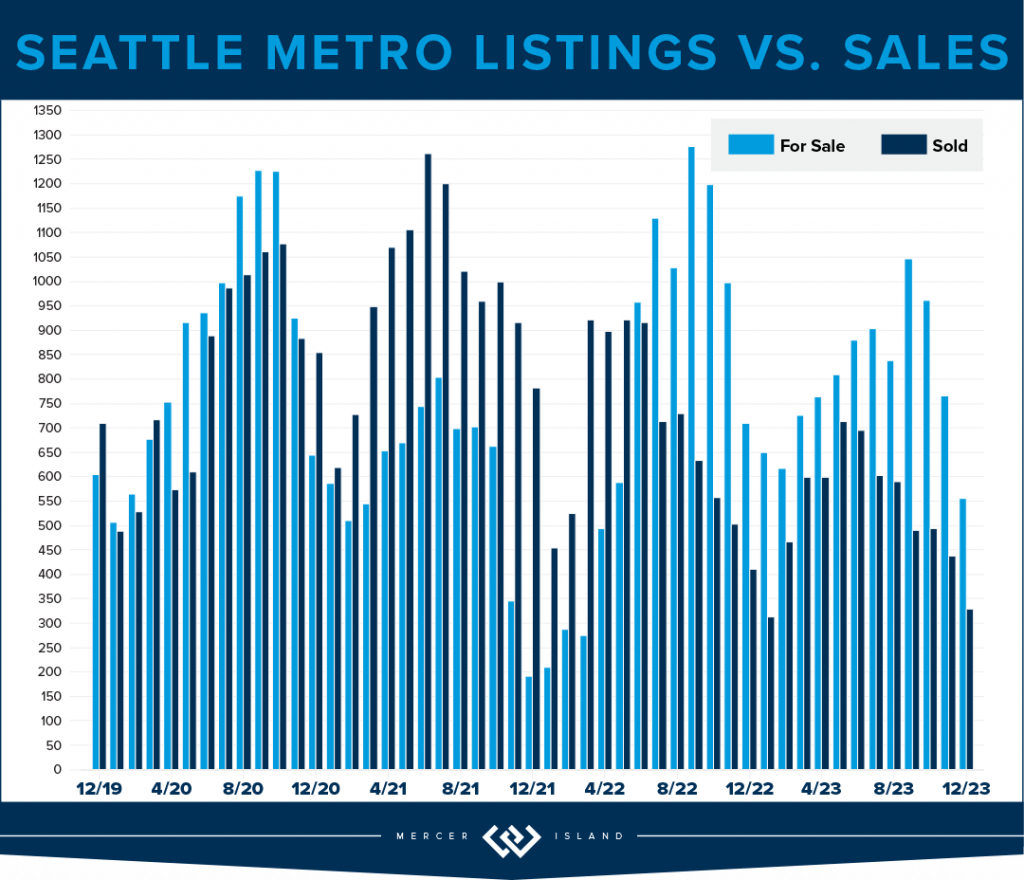
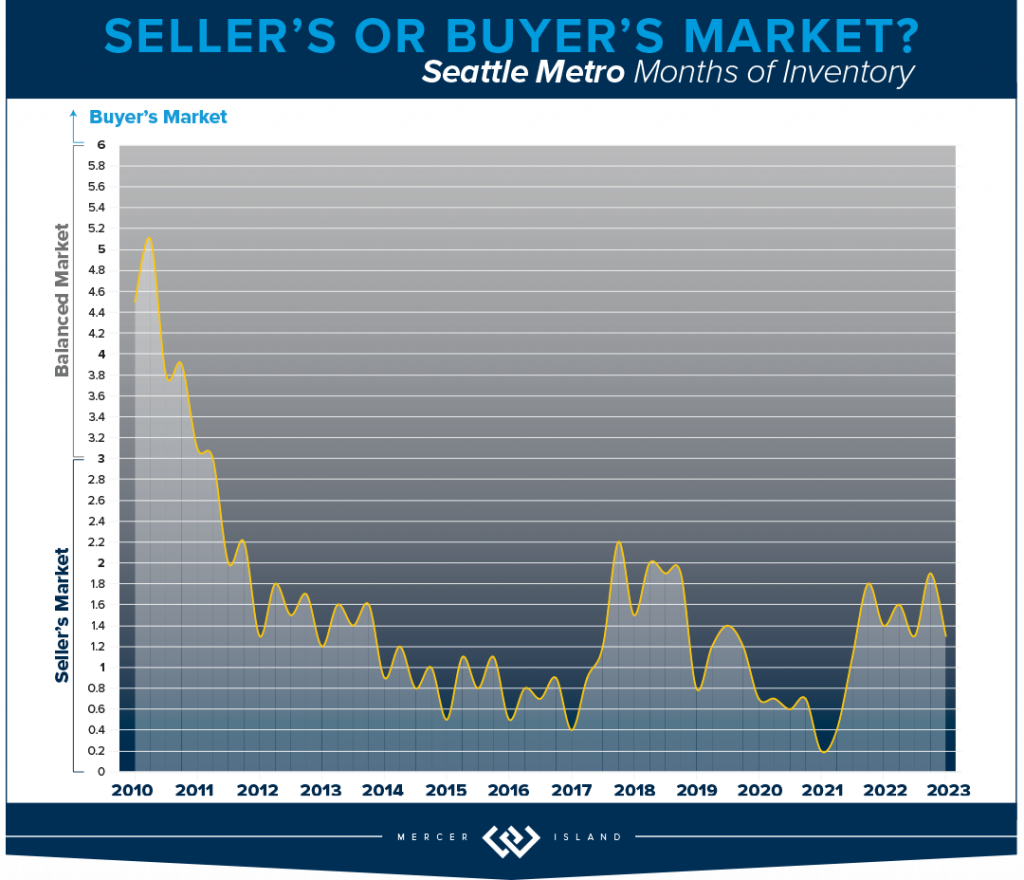
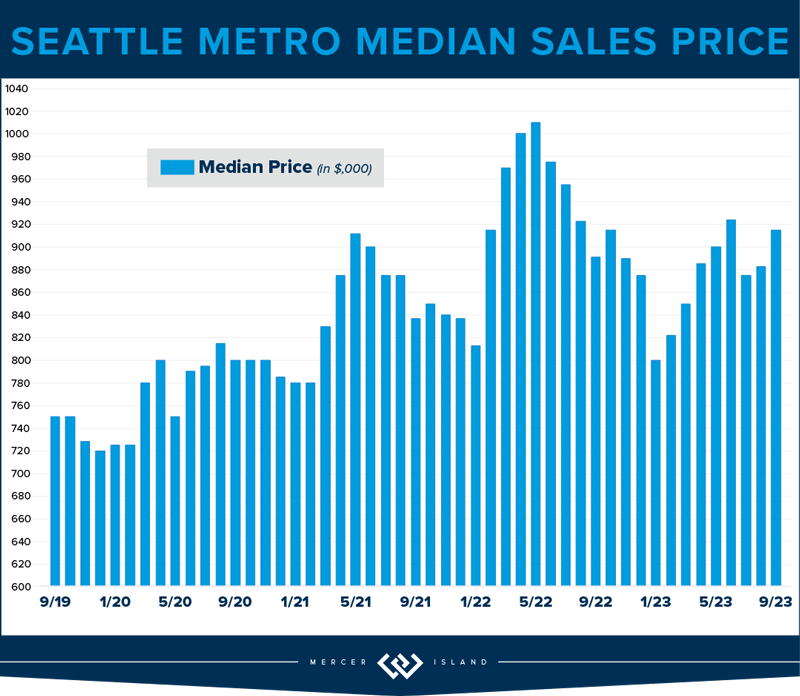
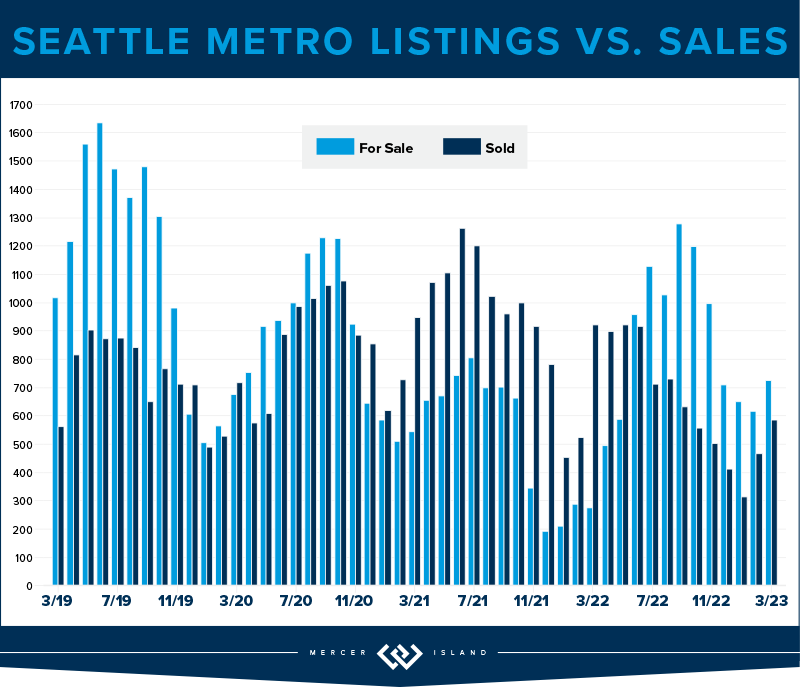
Would you like the good news or the bad news? Bad: Overall home prices slid in the city by 7%. Good: 57% of all homes sold in the first 10 days and for 104% of list price. While we may have backed off of our head spinning pandemic list/sale percentages, we’re still going strong. To us what this means is: if you’re considering selling there is probably a buyer ready and waiting to make you an offer. It just won’t be quite as lucrative as it might have been in 2022. It could be a lot worse given the high cost of money in 2023. Homeowners certainly came out ahead and Seattleites have our chronically low inventory and stable job market to thank for this!
We finished the year with sales down 23%, a figure made a lot less scary by the fact that listings were also down city wide by 24%. North Seattle east of I-5 saw the most stable prices, only losing 2% at a median price of $976,000. Queen Anne/Magnolia lost 10%, closing out the year at $1,263,000. It’s also interesting to note that 65% of homes sold for list price or better. This means we have mostly well counseled homeowners with reasonable expectations of what the market will bear.
If you’re in the market for a new home in 2024, Q1 is a great time! Inventory hasn’t been this low since 2012. If the cost of money goes down—as many experts are predicting—and more people decide to purchase, it could get very competitive very quickly! Beat the rush!
Click here for the full report and neighborhood-by-neighborhood statistics!

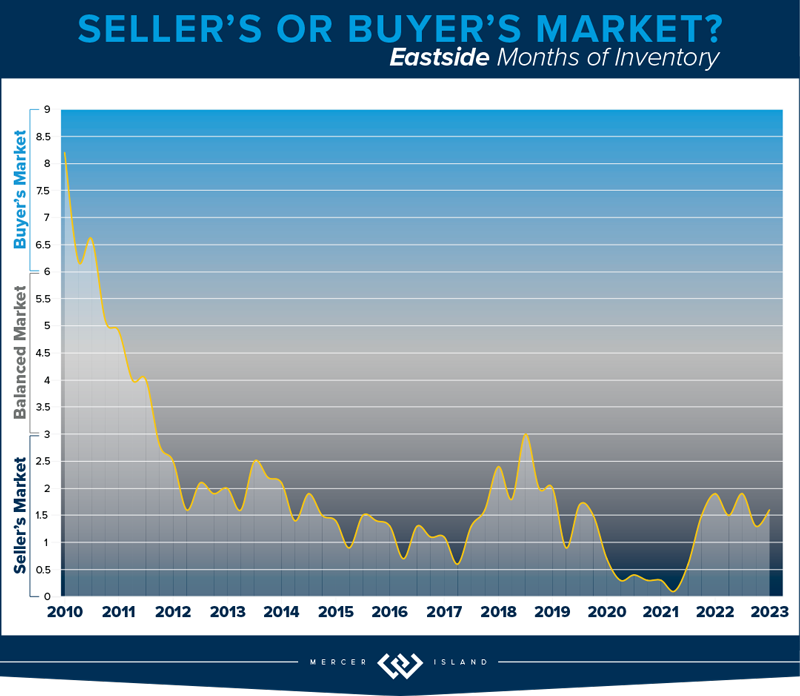
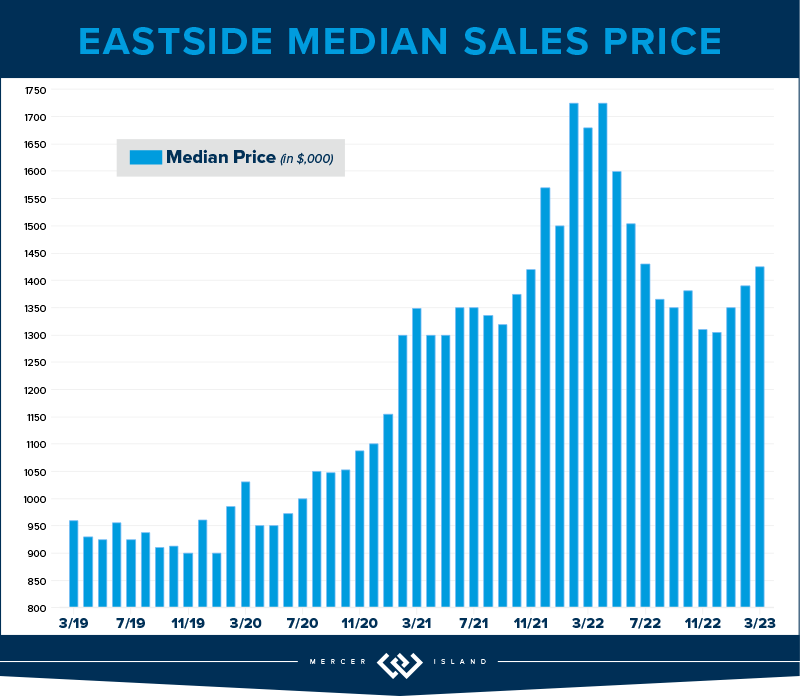
EASTSIDE
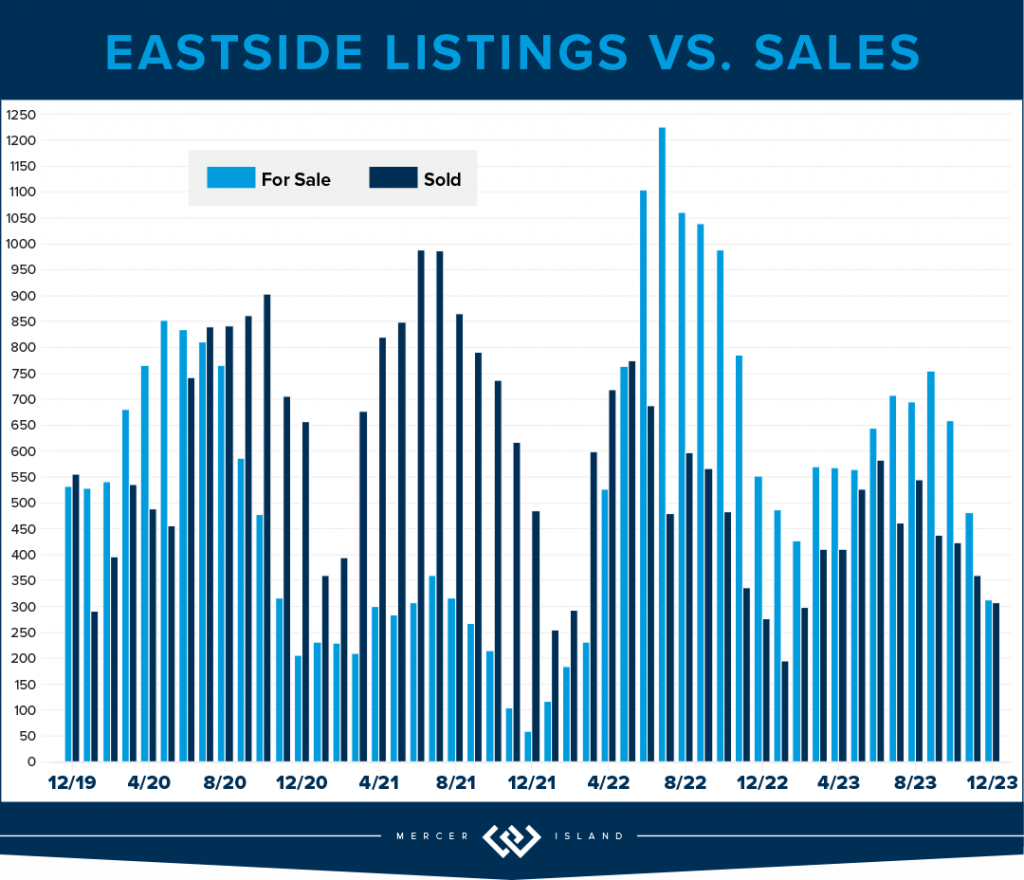
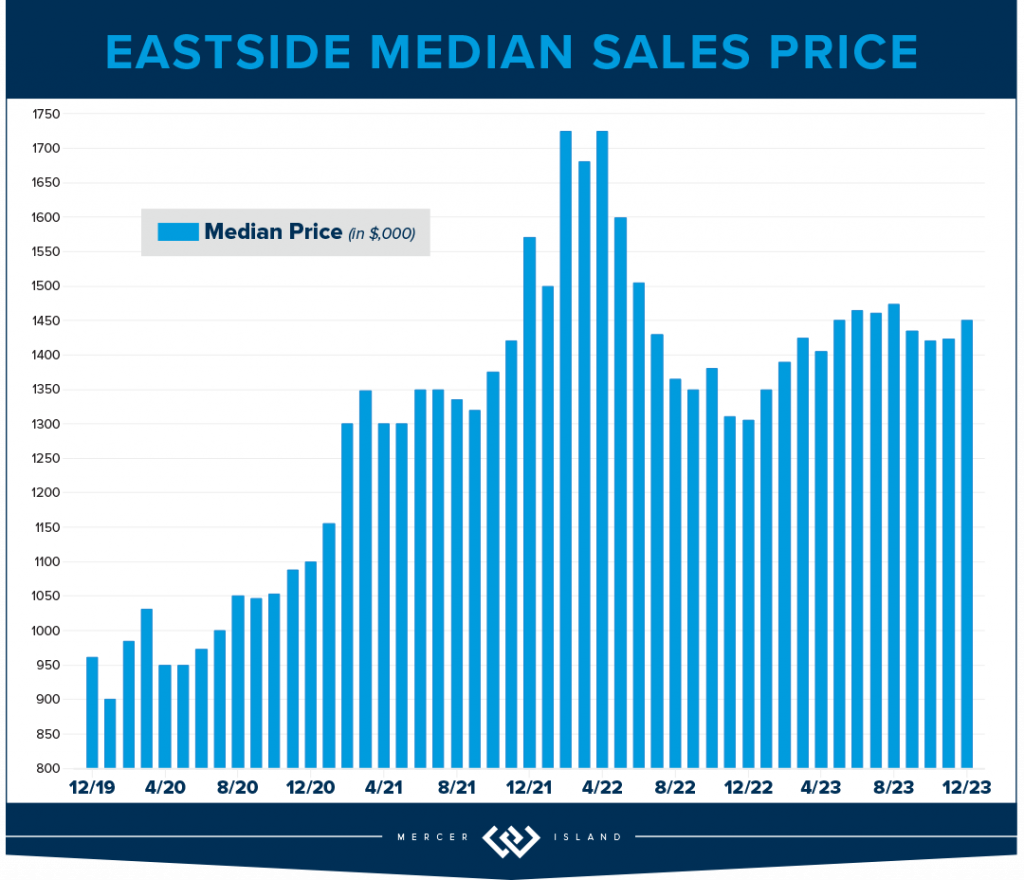
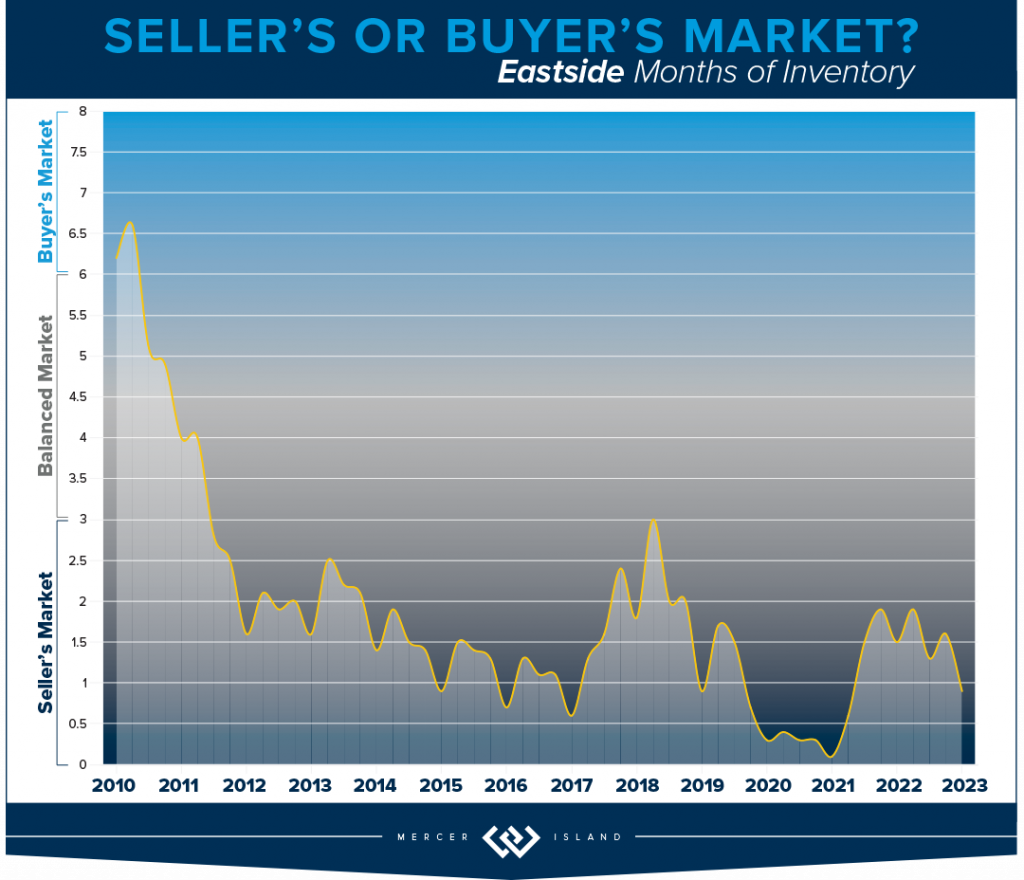
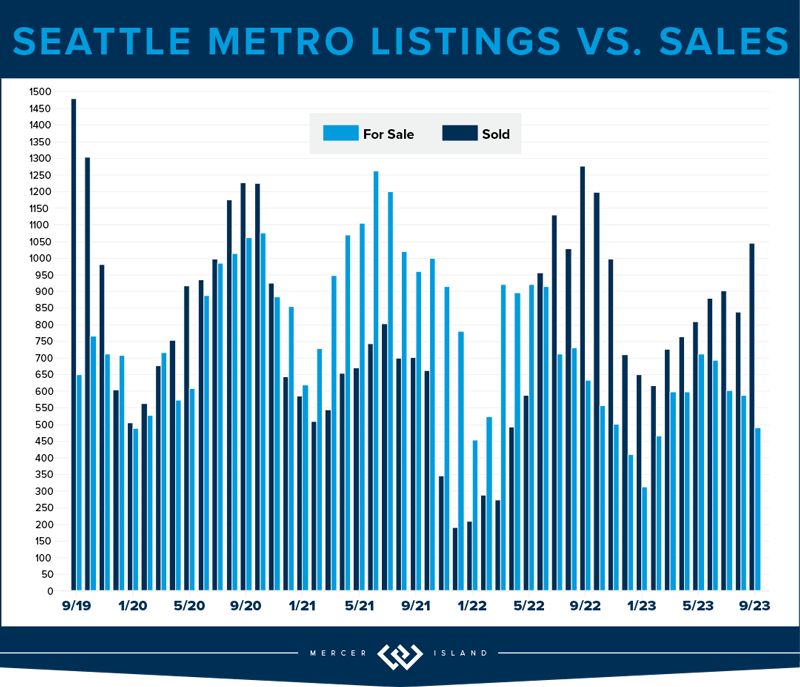
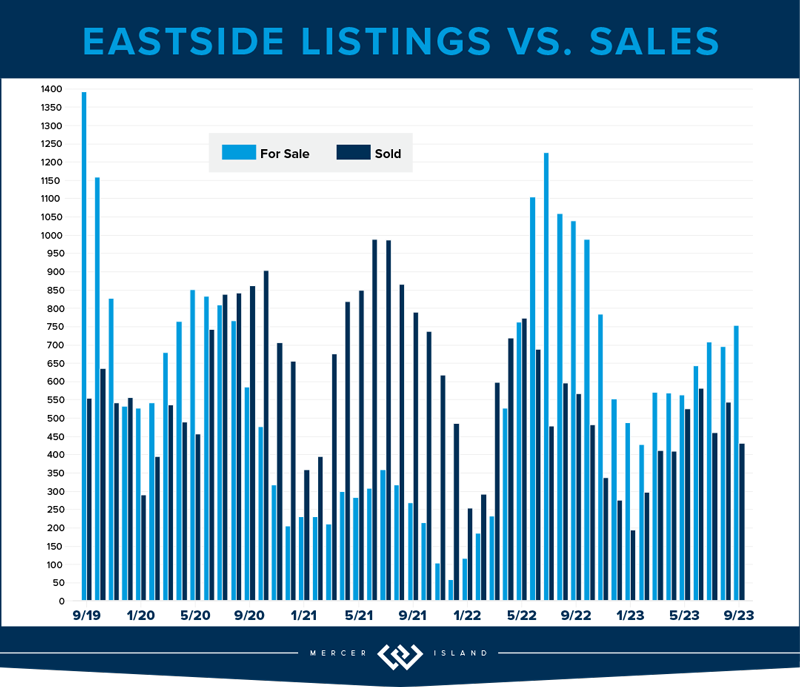
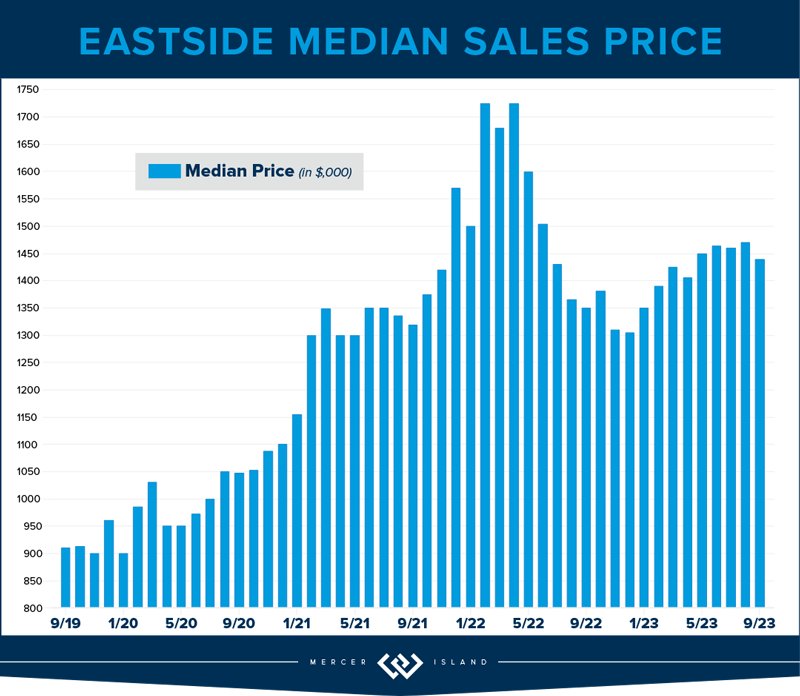
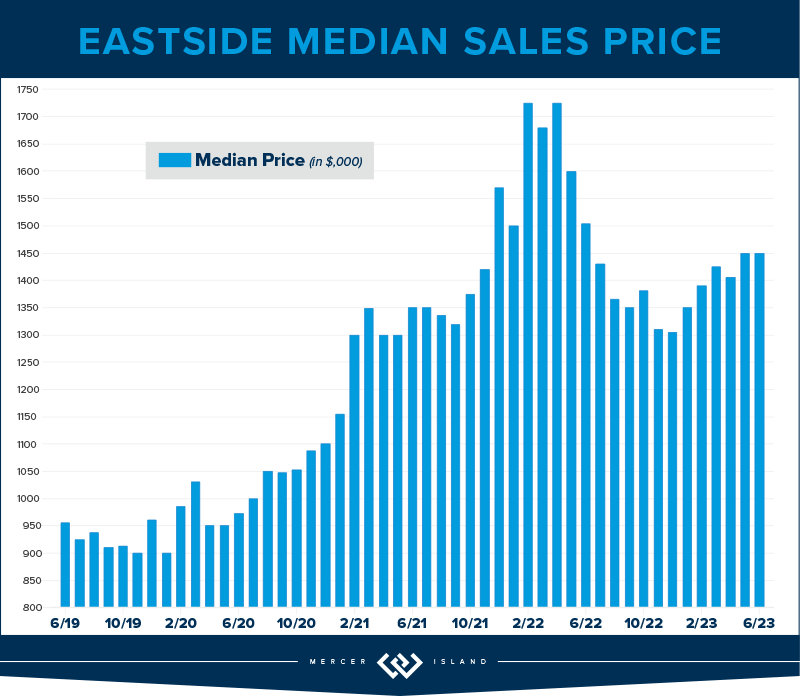
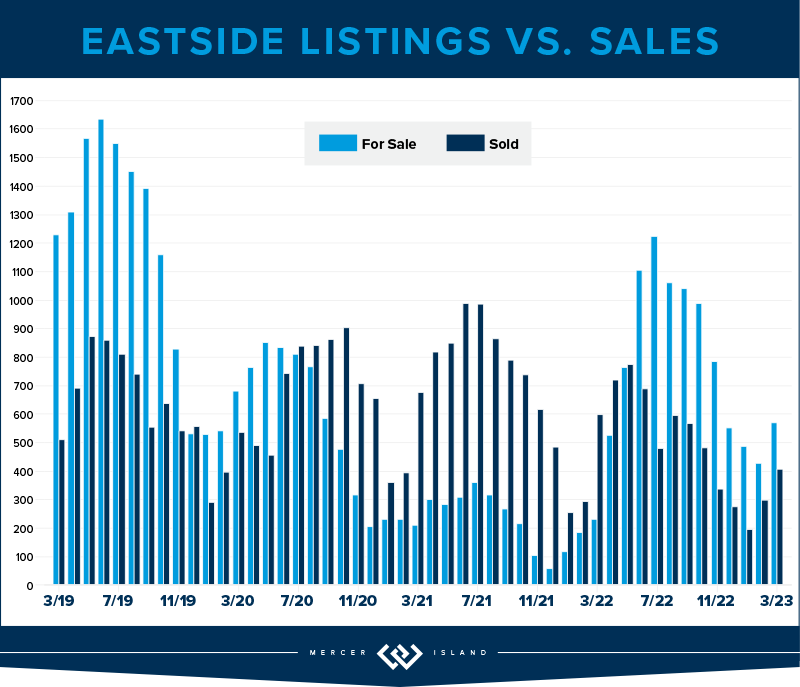
The Eastside median sales price was down by 4% as we closed out 2023. This is in large part due to the interest rates. It certainly isn’t supply and demand: Total listings were down 29% while sales only dipped 18% YOY. That’s staggering. Buyers and Sellers did not seem to be aligned in their estimation of the market: only 55% of homes sold for at or above list price while 45% needed a reduction or negotiation prior to accepting an offer. While this sounds balanced, it’s out of the norm compared to our historic data.
Sammamish was the strongest overall area with a whopping 1217 sales (25% of the total 4954) and the lowest median price dip of 3%; $1,400,000 in 2023 v. $1,450,000 in 2022. Mercer Island was the hardest hit with a 12% drop in median price to $2,239,000—the lowest since 2020. Corrections are healthy for the long-term health of a real estate market. We’re not sure how long this one will last; all signs are pointing to continued low inventory. It seems to be a game of chicken with the interest rates that could lead to massive pent-up demand.
If you’re in the market for a new home in 2024, Q1 is a great time! Inventory is at its absolute 15 year low (6,140 listings compared to a high of 10,880 in 2010) which means we are poised for a market flip. If the cost of money goes down—as many experts are predicting—and more people decide to purchase, it could get very competitive very quickly! Beat the rush!
Click here for the full report and neighborhood-by-neighborhood statistics!
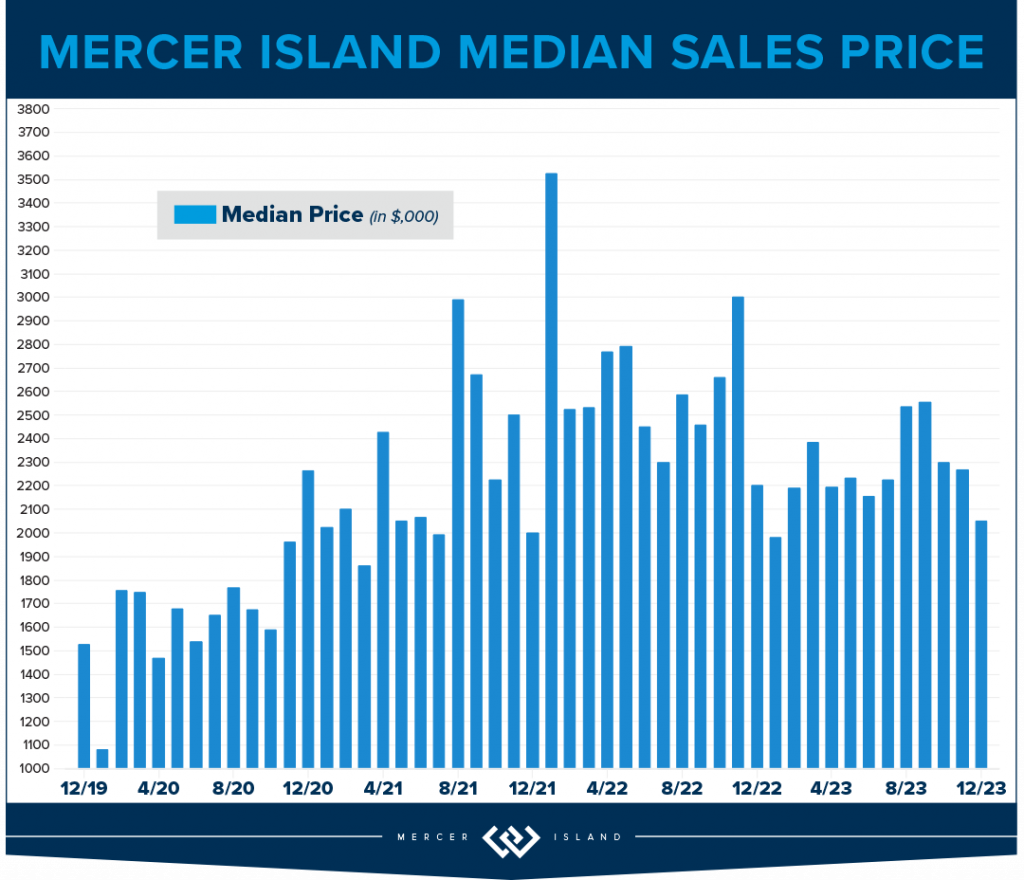
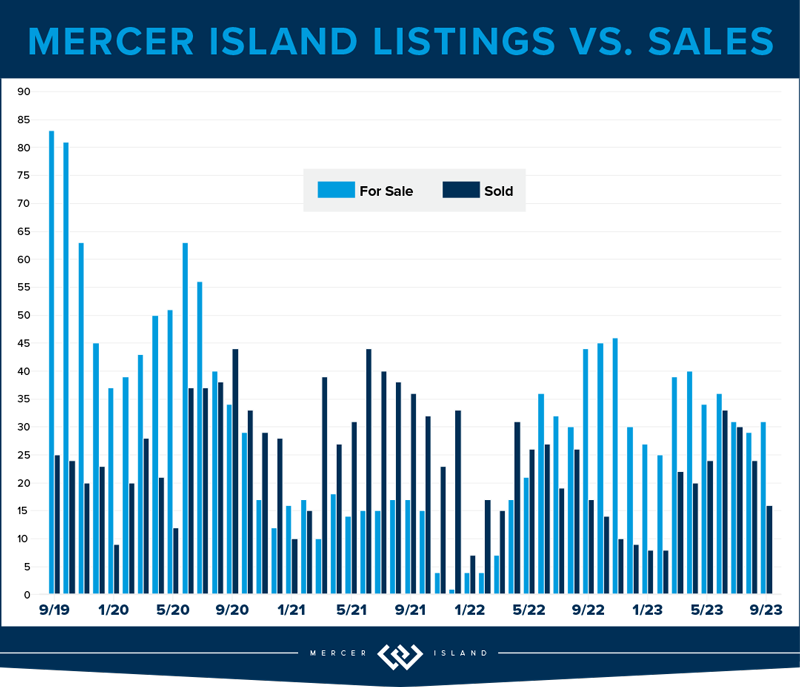
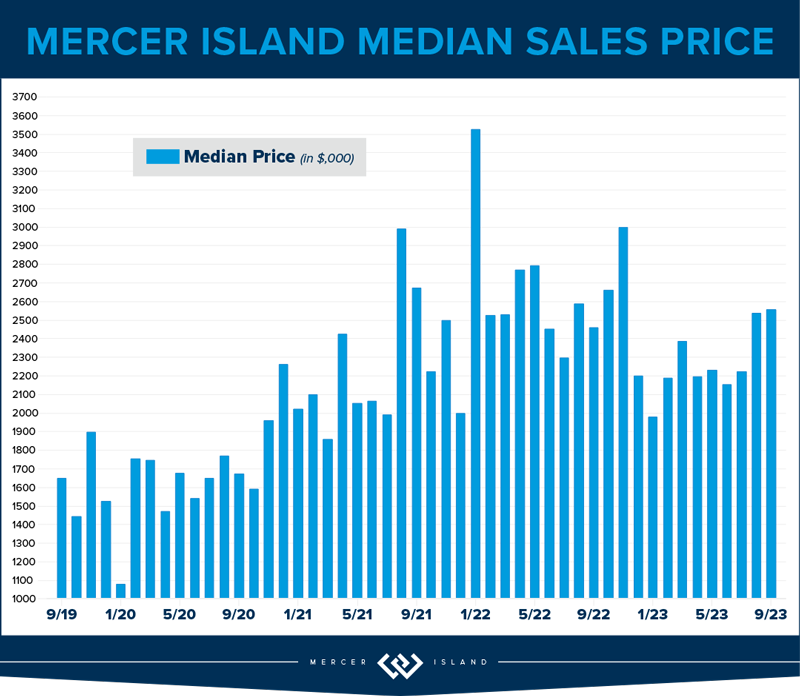
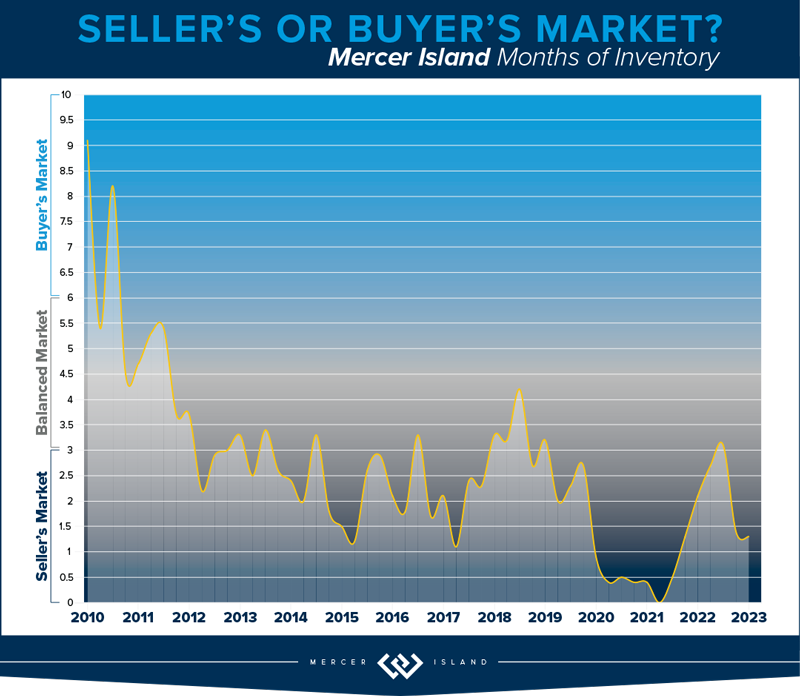
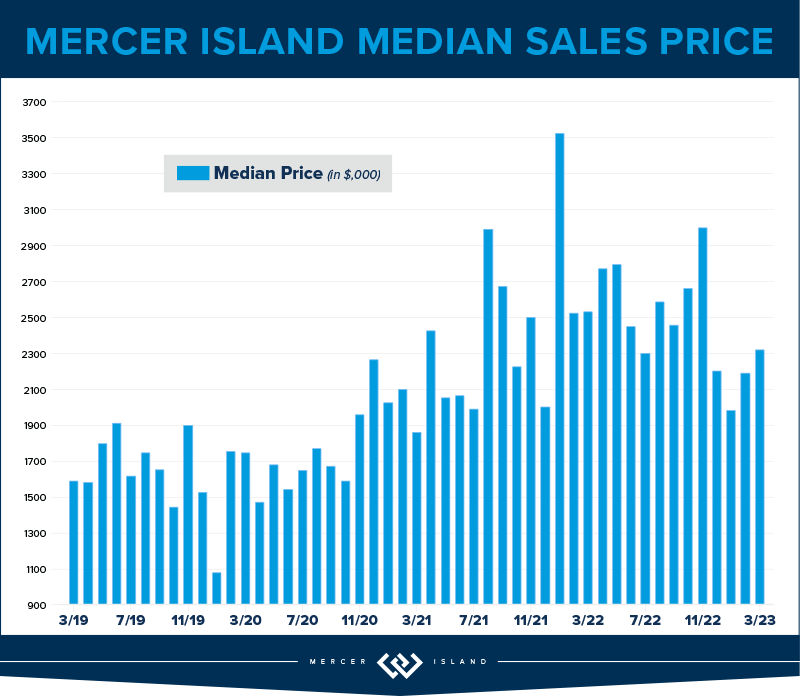
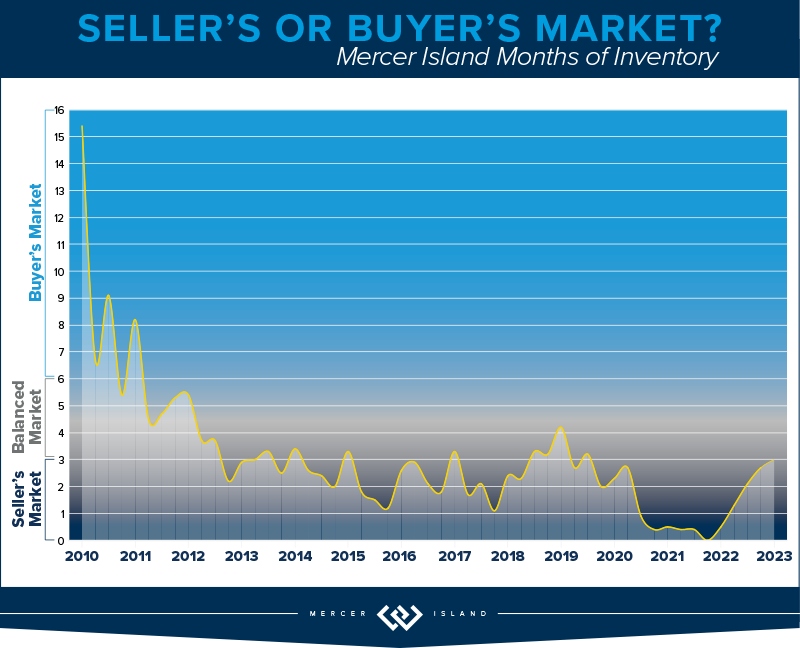
MERCER ISLAND
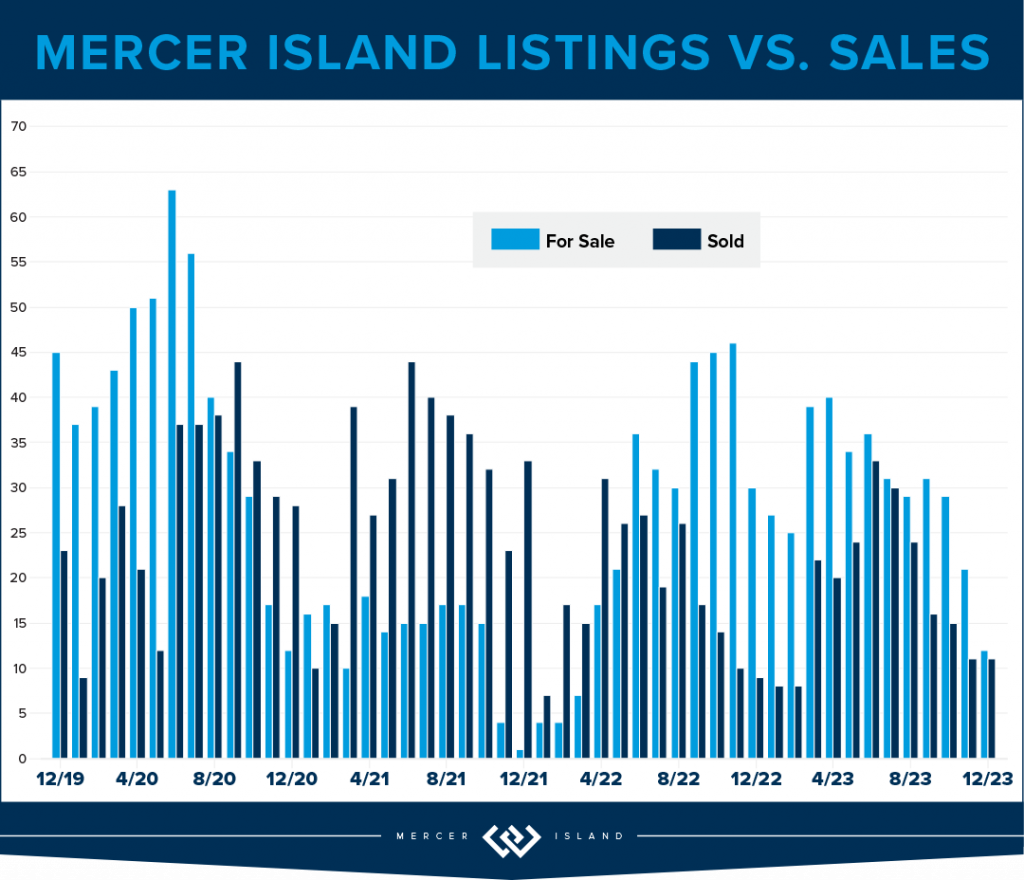
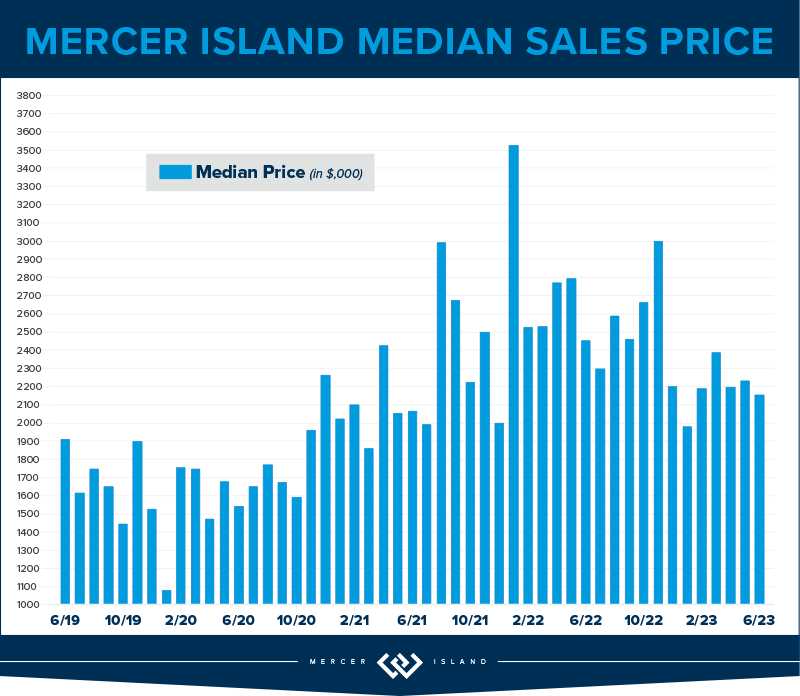
The Island saw just 289 new listings last year, only 60% of the peak 488 in 2013. There are some numbers that show we had very realistic homeowners in 2023: a 78% absorption of listings, (222 sales, up from 218 in 2022) and 98% list/sale price. When buyer and seller expectations meet, magic happens. The median price in 2023 was $2,239,000 back to around the same level as 2021—if you remember, this was a 30% increase from $1,700,000 in 2020.
Condos on the Island are off 8% to $620,000 from the 2022 high of $674,000, this is a strong showing. For the previous 4 years (2018-21) median prices were in the $500’s. There were only 33 sales Island-wide, the lowest number of total sales in 15 years. Listings were down as well: the lowest level since 2012. The metrics show that the market was strong, even with the dip in median sales price: 19 days on market, 99% list/sale price ratio, on average only 4 listings were active at one time. These are all signs of a constricted inventory/sellers’ market, which is what will eventually drive prices higher.
All in all, MI is holding strong to the price gains made during the pandemic. We are bullish on our market in 2024 as interest rates are easing. Time will tell.
Click here for the full report and neighborhood-by-neighborhood statistics!

CONDOS – SEATTLE & EASTSIDE
Whew! What a year! The major condo headline for both Eastside and Seattle condos: Prices hold steady while demand dips 25%! While this is sensationalized, it’s true. Likely due to the fact that inventory was also down by 20%, which means that supply and demand remained aligned and shielded homeowners from what could have been a massive hit to their bottom lines.
On the Eastside, when the dust settled, prices are down by 1%. The largest drop in median price was East Bellevue losing 11% while Kirkland soared above all other neighborhoods with double digit gains (up 19%). Other areas of note: West Bellevue topped the charts with a median sale price of $880,000! This is higher than the $876,000 residential median sale price in the city of Seattle.
Speaking of Seattle, the condo market in the city reminds us of The Little Engine That Could. Chugging merrily along despite having the odds stacked against it: I think I can! Overall, the city posted a 5% gain year over year with record high median sales price of $546,000. Downtown saw the highest overall unit volume at 439 total sales, while Greenlake/Ballard boasted the highest overall gain in median price at 15% appreciation. All good news, finally.
Check out area-by-area details the full condo report.
WATERFRONT
While Seattle and the Eastside both posted fewer waterfront sales in 2023 than in 2022, Lake Sammamish saw a big 40% year-over-year jump in sales. Mercer Island’s sales increased by a more modest 10%.
The highest waterfront sale of 2023 was $20 million for a breathtaking Evergreen Point estate on 115 feet of prime low-bank shoreline. Listed by Windermere and truly unique with a custom home designed by Hal Levitt, it sold its first day on the market (and well above the $18.5m asking price!).
The most modest waterfront sale was a 1,749 sq. ft. Lake Sammamish home sold by the owner for $1.62 million. It featured 25 feet of lakefront and big lake/mountain views.
Click here for the full waterfront report with top sales for the entire Seattle-Eastside private waterfront market, including Mercer Island and Lake Sammamish. The data is interesting and insightful (but cannot replace an in-depth waterfront analysis with your trusted professional).


We earn the trust and loyalty of our brokers and clients by doing real estate exceptionally well. The leader in our market, we deliver client-focused service in an authentic, collaborative, and transparent manner and with the unmatched knowledge and expertise that comes from decades of experience.
© Copyright 2024, Windermere Real Estate/Mercer Island. Information and statistics derived from Northwest Multiple Listing Service and Trendgraphix, and deemed accurate but not guaranteed. Seattle cover photo courtesy of Team RAREnorthwest and Baylee Reinert with Clarity NW Photography. Eastside cover photo courtesy of Donna Cowles and Kelly Morrissey with Clarity NW Photography. Mercer Island cover photo courtesy of the Oordt Ceteznik Realty Group and Clarity NW Photography. Condo cover photo courtesy of Fred Fox and Brandon Larson with Clarity NW Photography. Waterfront cover photo courtesy of Anni Zilz and Andrew Webb with Clarity NW Photography.
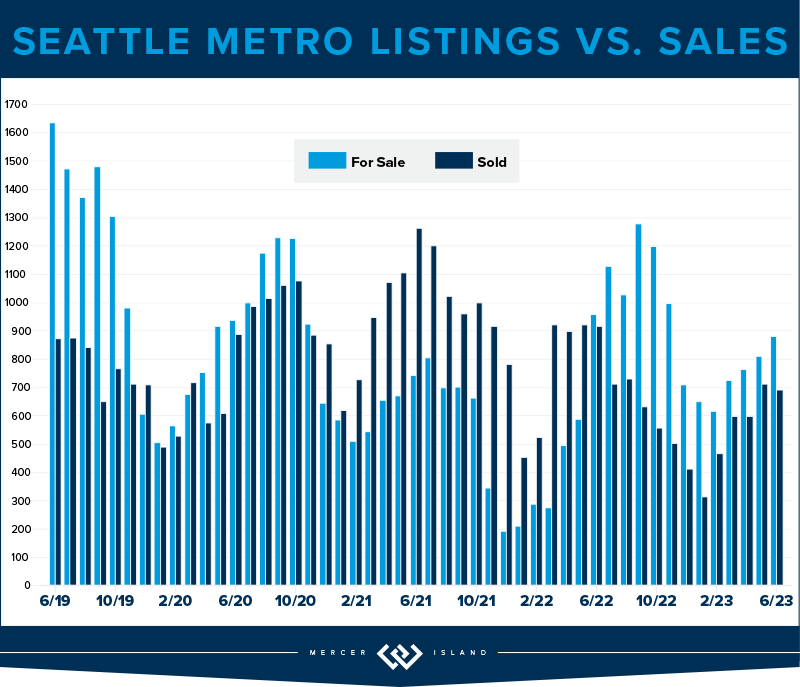
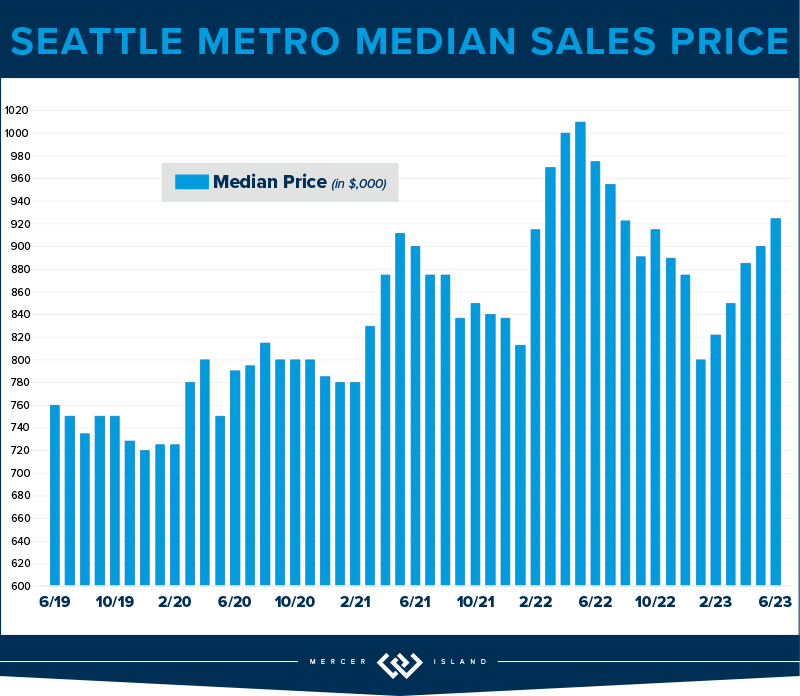
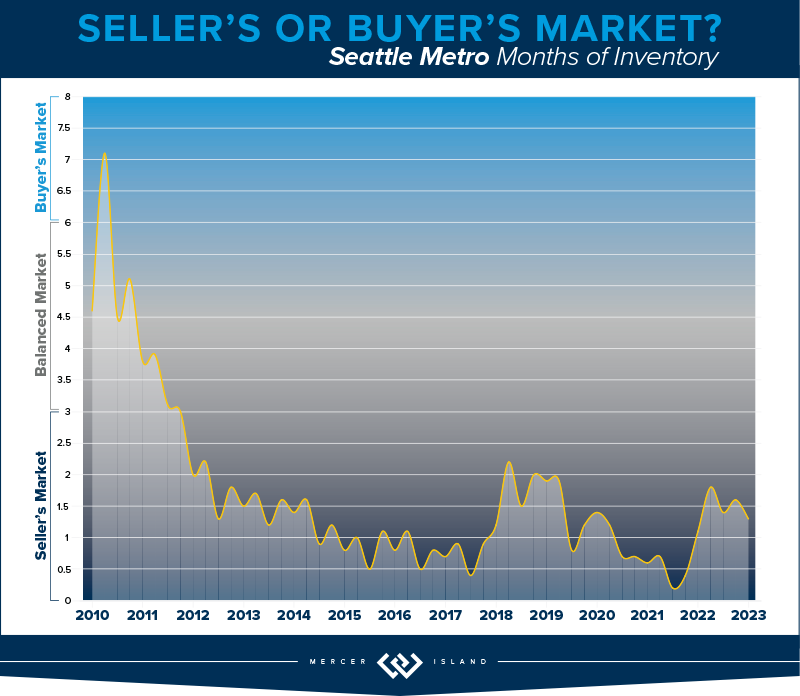
How’s the Market? Q3 2023 Review of Seattle Area Real Estate

While median sales prices varied quite a bit from area to area, they stayed relatively stable with most communities posting either modest gains or slight declines compared to this time last year. Low inventory is keeping us in what you might call a “flat” seller’s market…supply is low but prices aren’t appreciating as fast as we would normally see. That being said, if rates float down—and experts believe they will—we could see another frenzy of bidding wars as buyers compete for the few homes on the market. If you’re considering purchasing a home (even if you need to sell yours first), our advice is to get out there and start shopping while you can pick and choose at relatively reasonable prices…
Click or scroll down to find your area report:
Seattle | Eastside | Mercer Island | Condos | Waterfront
SEATTLE
The Seattle residential market showed resilience in Q3 of 2023. While the $894,000 median sales price was down 3% from last year, 60% of sellers fetched sales at or above their list price and 58% sold within the first 10 days. The city saw 2,321 new listings, a 23% reduction from the previous year. This is healthy, for now, with decreased demand due to rising interest rates. When rate pricing eases—and it will according to experts—the lower inventory will be sure to send prices through the roof. NOW IS THE TIME!
Diving deeper into communities, Queen Anne, with its blend of historic charm and modernity, saw a 1% rise in median sales prices to $1,349,000. Kenmore and Lake Forest Park have also held their own—60% of homes sold within the first ten days and both median sales prices and cost-per-square-foot went up 2% over last year. North Seattle remains a strong contender in the market, with 68% of homes selling at or above the list price. West Seattle, with its coastal vibe, saw a remarkable 72% of homes sell at or above the listing price.
The data underscores Seattle’s diverse and dynamic housing landscape, where different communities cater to varied tastes, yet all show promise and potential. Overall, Seattle’s housing market is marching on, optimistically steady, backed by strong analytical data and historically low unemployment.
Click here for the full report and neighborhood-by-neighborhood statistics!

EASTSIDE
The Eastside showed steady growth in Q3. With a notable 5% year-over-year rise in home values, the median sales price landed at a respectable $1,460,000. Interestingly, cost per square foot ($625) showed virtually no YOY change. Sellers saw a close alignment with their expectations, as the average list price to sale price for all properties stood at 99%. Furthermore, 58% of homes sold at or above their listing price, a testament to the region’s enduring demand.
Diving deeper, most communities remained fairly stable with modest year-over-year increases. Redmond, Mercer Island and Newcastle/North Renton saw slight declines. The star of the Eastside was West Bellevue, posting 23% more sales than Q3 of last year, a median sales price hike of 14%, and the highest cost-per-square-foot in the region (even after a 14% drop from last year). While overall sales were down about 13% across the region, this was counterbalanced by a 20% drop in new listings keeping the Eastside in a flat seller’s market for the foreseeable future.
Our conclusion? The Eastside’s market remains robust and versatile. Buyers and sellers both need to be savvy, understanding both their micro-markets and the broader trends. For sellers, strategic pricing and presentation remain king! Our advice to buyers: don’t sleep on this market, it will turn fast when interest rates float downward and inventory will not be able to keep up with demand.
Click here for the full report and neighborhood-by-neighborhood statistics!

MERCER ISLAND
While Mercer Island’s Q3 median sales price of $2,368,000 was still down slightly compared to Q3 of last year, prices have been trending upward since the beginning of the year. Furthermore, the average price-per-square-foot in Q3 was actually up 6% over last year. More than half of homes sold at or above their list prices (53%) and in 10 days or less (57%)—this is right on par with what we saw in Q3 of 2022. Buyers found room to negotiate on the remaining listings and were able to add contingencies for things like inspections and financing.
We saw a boost in sales compared to last year’s initial interest rate shock, despite a lower number of new listings. This has kept the Island in a flat seller’s market much like we saw in 2018. That being said, Mercer Island homes are taking longer to sell than we saw last year—the average total number of days properties spent on the market before receiving an offer went from 18 days in Q3 2022 to 30 days by Q3 2023. Buyers, perhaps more hesitant due to higher interest rates, are being careful to pick and choose before leaping into a contract.
Overall, the Mercer Island real estate market has remained fairly steady with some signs of growth. While median prices are still down from their spike during the post-COVID frenzy, we should start seeing year-over-year gains if this year’s upward trend continues. For prospective buyers, the landscape offers an opportunity to negotiate favorable deals on those properties that don’t sell right away. For sellers, astute pricing and marketing strategies will continue to win the day.
Click here for the full report and neighborhood-by-neighborhood statistics!

CONDOS – SEATTLE & EASTSIDE
The PNW condo market showed steady growth in Q3 of 2023, with year-over-year median sales prices up by 6% in both Seattle and The Eastside. Overall activity was subdued, however, with a drop in the number of new condo listings corresponding with fewer sales.
When dissecting Seattle’s condo statistics, Shoreline, Lake Forest Park and Kenmore saw the biggest price gains with a whopping 39% rise in median sales price compared to last year. Ballard and Green Lake also saw big gains with median sales price up 25%. Conversely, Shoreline experienced a stark 59% drop in sales and 40% drop in median sales prices, indicating possible shifts in buyer preferences toward the more convenient city center. While Downtown condo sales prices were also down slightly, their shimmering skylines still fetched a premium at $825 per square foot.
The Eastside condo market varied from area to area. Kirkland’s condo sales surged by 18%, with an impressive 43% increase in median sale price. Redmond also shone brightly with a 45% spike in median sale prices. Mercer Island stood out, with its 43% increase in the number of sales and 31% rise in median sale price showcasing its luxury market segment. Conversely, West Bellevue, East Bellevue, and East Lake Sammamish all posted lower year-over-year median sales prices—down -20%, -%12% and -7% respectively.
The juxtaposition of these two markets, and really the neighborhood specific swings within them, highlights the unique characteristics and demands of each, underscoring the need for prospective buyers and sellers to strategize based on specific community data. All the more reason to consult a condo pro!
Check out area-by-area details the full condo report.

WATERFRONT
Seattle once again commanded the highest number of private waterfront sales with 9 total—4 of these sold in 4 days or less, including 2 hot Beach Drive listings in West Seattle that sold above their asking prices. Lake Sammamish was close behind with 8 sales including one that sold immediately (and marked the most affordable waterfront sale at $1.62 million). Mercer Island boasted the highest waterfront sale of the quarter, a stunning North End estate on 120 feet of waterfront that went for $24.4 million. The Eastside held its own with 6 sales and the second highest sale of the quarter—$12 million—for a half-acre Yarrow Point estate on 105 feet of prime west-facing waterfront.
This brief overview of the entire Seattle-Eastside private waterfront market, including Mercer Island and Lake Sammamish, illustrates the trends occurring in our region over time. This data is interesting and insightful but cannot replace an in-depth waterfront analysis with your trusted professional.
We earn the trust and loyalty of our brokers and clients by doing real estate exceptionally well. The leader in our market, we deliver client-focused service in an authentic, collaborative, and transparent manner and with the unmatched knowledge and expertise that comes from decades of experience.
© Copyright 2023, Windermere Real Estate/Mercer Island. Information and statistics derived from Northwest Multiple Listing Service and Trendgraphix, and deemed accurate but not guaranteed. Seattle cover photo courtesy of Codi Nelson and HD Estates. Eastside cover photo courtesy of Team RAREnorthwest and Elevato Photography. Condo cover photo courtesy of Jessica Livingston and im3rd Media. Waterfront cover photo courtesy of Anni Zilz and Clarity Northwest Photography.
Extended! Kicks for Kids Shoe Drive August 1-21

Help us give kids the confidence they need to start the school year right! My Windermere team and I invite you to participate in our Kicks for Kids back-to-school sneaker drive. It connects low-income youth in our local communities with new shoes for the upcoming school year. Through August 21st, we’ll be accepting donations 3 ways:
-
Bring new or gently used sneakers (toddler/youth sizes) to my office at 2737 77th Ave SE, Ste. 100, Mercer Island. We’ll enter your name into a raffle for a delectable prize from Island Treats, and we’ll also match the first 100 pairs of shoes donated!
-
Shop from our Amazon Wishlist.
-
Contact me to arrange a pickup.

This year, we’re partnering once again with KidVantage (formerly Eastside Baby Corner), an amazing organization that helps kids thrive by providing resources and essentials with their 70+ partner agencies—many of which are school districts.
Help us make sure every child has a new pair of shoes for school!
![]()


© Copyright 2023, Windermere Real Estate/Mercer Island.
How’s the Market? Q2 2023 Review of Seattle Area Real Estate

While median sales prices rose in Q2 compared to Q1, they were still down about 10% from last summer’s peak. Most areas saw fewer new listings and sales this year than we saw last year. Supply levels are still low enough to keep us technically in a seller’s market — our Windermere Chief Economist, Matthew Gardner, predicted this will continue, saying, “with relatively few homes on the market and the share of homes with price reductions dropping and list prices rising again, I just can’t see a buyer’s market appearing this year.”
Click or scroll down to find your area report:
Seattle | Eastside | Mercer Island | Condos | Waterfront
SEATTLE
The Seattle market felt a similar adjustment as the Eastside with home prices down about 10% across the board. This spring market had a 27% drop in supply which limited the overall sales. The median closed sales price of $900,000 is up from May’s $830,000, but down 10% year over year offering some relief to buyers feeling the squeeze of high interest rates.
Last quarter, we mentioned keeping an eye on North Seattle and the growth we’ve seen in Shoreline, Lake Forest Park and Kenmore likely due to transit and those seeking affordability. Interestingly, 80% of the Lake Forest Park and Kenmore homes sold at or above their list price (in comparison to Queen Anne at 62%, for example) with prices rising 14% since last quarter but down 19% year over year.
Q2 closed with 879 active residential homes on the market, but no real sense of urgency from buyers (although the average days on market was 20 compared to the Eastside’s 23 days). The presentation of a home coupled with a smart pricing strategy equates to a positive outcome for sellers — we can see this in the 42% of homes that experienced multiple offers with an average boost of 6% over list price. With that said, 26% of Seattle contracts experienced a price negotiation between parties, so if you’re a motivated buyer and write an offer, you could benefit from more traditional contract terms.
Click here for the full report and neighborhood-by-neighborhood statistics!
EASTSIDE
The Eastside residential market adjusted significantly this quarter. With a median price of $1,450,000 across all neighborhoods, this is an adjustment of 10% compared to last year. West Bellevue real estate, a luxury market, took the largest adjustment of 16%, down to an average of $996 per square foot. Market times were also slightly longer with 66% of homes selling within the first 10 days; the other 34% of homes had to be more patient in finding their buyer. This means that it took an average of 23 days for a seller to sell their property compared to 7 days at this time last year. However, this is much improved from 52 days in Q1!
Just like Redmond’s condos, its single family residential supply numbers were down 43%—but offered more supply than this time last year. Overall, there were 40% fewer listings than in Q2 of last year. With just 645 active homes available at the end of this quarter and rates closing out ~6.75%, low supply and high interest rates have kept sales stagnant. This time last year, there were 1,105 homes available for sale and rates had just moved across the 5% level.
It’s very true that sales are still happening and price and presentation from the seller matter most. On the Eastside, 39% of homes sold above their list price at an average of 5% over. Many buyers have adjusted their budget with the higher rates and seem motivated to get into the market now when the right home is found. If you can afford the payment, take the leap as a buyer. Sellers are motivated to accept more traditional terms, and you may not be competing amongst others.
Click here for the full report and neighborhood-by-neighborhood statistics!
MERCER ISLAND
Much like other Eastside neighborhoods, Mercer Island made a significant adjustment in price—but one area of difference is that supply has remained steady. The south end offered the largest number of sold homes with 20, followed by 16 sold homes mid-island and 12 sold homes on the north end. Mid-island pricing continues to be smack in the middle with an average median sales price of $2,249,000; 75% of mid-island homes sold at or above their listing price, evidence that the desirability of being tucked away from freeway and amenities while still accessible to all is very appealing. Overall, island pricing has adjusted by 19% year over year to a median of $2.2 million compared to $2.7 million this same time last year.
There are currently 36 active homes on the market at the end of this quarter, which is identical to our supply level Q2 last year! This is up slightly from 39 active homes at the end of last quarter. The island is also feeling the pause in demand and urgency and that’s evident in the days on market numbers. Average days on market was 31 this quarter; it only took 7 days to sell your home this time last year. The inventory of homes for sale continues to be unique and striking, and a great pricing strategy equates to both happy seller and happy buyer.
Click here for the full report and neighborhood-by-neighborhood statistics!

CONDOS – SEATTLE & EASTSIDE
For first time homebuyers, condos are still a fantastic starter purchase, whether you want to invest, live in the city or in a more suburban environment. We didn’t experience the same urgency with condo buyers this Spring likely because of interest rates, the fear of tech layoffs, or the transition from remote work to office work.
Year over year, neighborhoods like West Seattle, North Seattle, Queen Anne and Ballard saw strong price gains while South Seattle and Capitol Hill took a 20% median price adjustment. While it’s tough to find a direct correlation for neighborhoods tracking significantly different than others, the price gains are likely due to supply issues in these popular neighborhoods. On the flip side, price adjustments could be a sign that sellers had higher expectations of price before correcting to a normal level with a reduction or negotiation. There were 565 units available at the close of the quarter, down from 605 active units at the close of Q2 last year. Sellers are likely staying put for now, or they are investors with a low interest rate mortgage. Lake Forest Park and Shoreline condos triumphed over others with 81 percent of the 16 total condos selling at or above their list price; 70% of these units sold within the first week.
On the eastside, East Bellevue and East of Lake Sammamish had rising median prices with an average increase of 6% year over year, while other eastside neighborhoods adjusted downward. Redmond condo supply was down 41 percent! Again, this number reflects sellers staying put and with current interest rates hovering around 6.5% today, there may not be a suitable option for them to consider “trading up” to a larger unit or a single family home. With lack of supply and high rates, total sales are stagnant.
Check out area-by-area details the full condo report.

WATERFRONT
Most of the waterfront sales this quarter happened in Seattle with 14 sold homes compared to 6 sold homes last quarter. Just two Mercer Island waterfront properties, located on the north end, sold this quarter (the same number of sales as last quarter!) one with significant competition selling $750,000 above its listing price in just four days. In regard to eastside waterfront homes, while there was just seven sales (also the same number of sold homes as Q1 this year), four of those homes sold in five days or less including a $14m waterfront property on Hunts Point.
This brief overview of the entire Seattle-Eastside private waterfront market, including Mercer Island and Lake Sammamish, illustrates the trends occurring in our region over time. This data is interesting and insightful but cannot replace an in-depth waterfront analysis with your trusted professional.

© Copyright 2023, Windermere Real Estate/Mercer Island. Information and statistics derived from Northwest Multiple Listing Service and Trendgraphix, and deemed accurate but not guaranteed. Mercer Island cover photo courtesy of Cynthia Schoonmaker and Clarity Northwest Photography. Eastside cover photo courtesy of Joe Liu and Clarity Northwest Photography. Condo cover photo courtesy of Team RAREnorthwest and Elevato Photography.
How’s the Market? Q1 2023 Review of Seattle Area Real Estate

The first quarter of 2023 saw a price correction compared to last year’s spike, with year-over-year median prices down by 9% in Seattle and 14% on the Eastside. That being said, prices are already beginning to climb again with steady growth since the beginning of the year. Buyer demand remains strong despite higher interest rates—competitively priced, well-presented homes are still fetching multiple offers.
Click or scroll down to find your area report:
Seattle | Eastside | Mercer Island | Condos | Waterfront
SEATTLE
For those who purchased a home in Seattle this quarter, it likely felt like there were more options and inventory with a minor rebalance on price. While transactions were down 28% year over year, we also saw median sales price was down from $925,000 to $830,000 since last quarter, which is a 9% adjustment. A down correction in pricing gave relief to buyers feeling the pinch and stress of rising interest rates to 6.5%. Rates have doubled the past 1.5 years but, considering the limited supply of homes for sale, the drop in home prices hasn’t been severe.
Neighborhoods like Lake Forest Park saw growth in their number of transactions (up 15%); other neighborhoods like Madison Park and Capitol Hill had nearly half the homes for sale compared to last year. It’s no surprise that as interest rates rise and affordability changes, buyers are casting a wider net to other parts of Seattle to the north. Keep an eye on neighborhoods like Shoreline, Kenmore and Lake Forest Park. Desirable prices paired with accessible transit is a bonus for those who are being asked to return to the office.
Multiple offers are apparent in some neighborhoods (price & presentation is key!) and we did experience 30% of homes sell above their listing price. If the shortage of inventory remains and interest rates drop slightly, we could see the frequency of multiple offers increase.
Click here for the full report and neighborhood-by-neighborhood statistics!

EASTSIDE
The Eastside was struck by job layoffs in the tech sector, rising interest rates and new property listings (28% more homes than last quarter!) but pending sales remained low compared to the previous year. Transaction volume was much like Seattle’s, with a decline of 22%. Mercer Island was the only community that stayed steady (no increase) in the number of transactions year over year.
Interestingly, while prices are down to a median of $1,400,000 year over year, this is a slight 2% increase from last quarter’s median of $1,380,000. 20% of the properties on the Eastside also sold above their listing price (most of these homes were in Bellevue) while sellers needed a shift in expectations with a whopping 58% of homes needing a price improvement to find their buyer. The list price vs. sold price percentage was 97% which means if you were a seller who listed your home at $1,000,000, you would expect to sell for $970,000 this quarter. Again, price and presentation matter and 41% of sellers who did this well sold in the first 10 days.
Buyers who are shopping for homes on the Eastside continue to be hyper focused on the school districts, turn-key properties and are serious about locking in their interest rate now, with the hopes of refinancing later this year when economists predict rates could decrease. If rates drop below 5.5% coupled with low inventory levels, we could see the frequency of multiple offers increase.
Click here for the full report and neighborhood-by-neighborhood statistics!

MERCER ISLAND
Even though there were just 39 residential transactions on Mercer Island this quarter, that number has stayed perfectly steady year over year. Over half of these homes sold in the first 10 days on the market, which is no surprise as demand has stayed robust.
13% of listings sold above their listing price, but this wasn’t concentrated on a certain community; four homes located on First Hill, Mid-Island plus the South & North Ends respectively, each received multiple offers this quarter. Q1 of 2022 saw a median price of $2,540,000 with just one home listed under $1,500,000. This quarter, the median price is $2,233,000 (a 12% decline) while six homes sold under $1,500,000! Due to the decline in prices and a slower start to the year, many sellers needed a shift in expectations with a whopping 67% of homes needing a price improvement to find their buyer.
We haven’t seen the number of new listings in the double-digit figures since Q2 of 2022, and it’s very possible we won’t experience that same level of inventory this year. Baby boomers are holding onto their homes with the benefit of their remarkably low 2.75% interest rate, and families are staying put to finish out the school year.
Our advice still stands: if you’re thinking about waiting for lower rates AND lower prices, you might be dreaming. Enjoy the fantastic Island inventory now, lock in your rate and consider refinancing later this year or next spring when economists predict rates will shift down.
Click here for the full report and neighborhood-by-neighborhood statistics!

CONDOS – SEATTLE & EASTSIDE
Seeing first time homebuyers come back to the market or considering an investment? Buying a condo in Seattle or on the Eastside is a fantastic opportunity, especially as many companies are calling their employees back to the office at least 3 days per week. It’s very possible transaction volume will be up next quarter, but for now, transactions were down 44% year over year. With that said, 465 units sold in Seattle; 347 units sold on the Eastside which isn’t all doom and gloom.
Just like North Seattle is heating up with residential sales, Lake Forest Park, Shoreline, Ballard and North Seattle condos outpace the rest of Seattle, up 10% on average. These areas are experiencing new construction townhomes that are especially desirable to first time homebuyers. Boutique builders are offering a trendy design palette (have you seen the Scandinavian-style design with light woods and sleek finishes?) paired with all the “bells and whistles” that city dwellers appreciate, like dog washing stations, artificial turf, and EV chargers.
For the Eastside, Redmond condos stayed the steadiest, down just 17% year or year. Kirkland was the only neighborhood to experience a price bump, up 11% to a median price of $693,000.
The Seattle condo median price has declined just 1% year over year to $515,000, while the Eastside experienced a 12% adjustment to $550,000. This is a $530,000 average when comparing both areas. With interest rates doubling the past 1.5 years and buyers considering a condo unit under the umbrella of a condo association, shoppers will be very particular about their monthly dues assessment and what’s included for those monies as both interest rates and dues have such a dominant effect on their overall buying power. Condos continue to be a necessary niche in our marketplace!
Check out area-by-area details the full condo report.

WATERFRONT
There were 17 privately-owned waterfront home sales in the greater Seattle-Eastside region in Q1 2023 (Eastside-7; Seattle-6; Lake Sammamish-2; Mercer Island-2). This is exactly on par with last year, when we also saw 17 sales in Q1 2022.
The highest sale was for a Medina Northwest Contemporary on 115 feet of low-bank waterfront that sold above list price for $20m. The most affordable waterfront was a unique triplex with 1920-1930 era beach cottages on a private boardwalk near the Ballard Locks—a buyer snagged it below list price for $1.9m.
This brief overview of the entire Seattle-Eastside private waterfront market, including Mercer Island and Lake Sammamish, illustrates the trends occurring in our region over time. This data is interesting and insightful but cannot replace an in-depth waterfront analysis with your trusted professional.

© Copyright 2023, Windermere Real Estate/Mercer Island. Information and statistics derived from Northwest Multiple Listing Service and Trendgraphix, and deemed accurate but not guaranteed. Mercer Island cover photo courtesy of Petra Varney and Clarity Northwest Photography.
Property Tax Relief Programs in King County

More than 26,000 low-income seniors and disabled people in King County who qualify for a tax exemption haven’t claimed it…are you or your family member one of them?
If you are homeowner, make $58k or less per year, and are either age 61+ or retired due to disability, there is a good chance you qualify. You can even retroactively apply for the exemption for the prior 3 years!
Scroll down for details on this exemption plus 4 other property tax relief programs that King County offers.
In another county? Here is the full list of income thresholds for every county in Washington State, and here is another link to view the programs each county offers.
Senior/Disabled Property Tax Exemption
WHAT IS IT?
A reduction in King County property tax for seniors, people with disabilities, and disabled veterans.
WHO QUALIFIES?
- Seniors age 61+
or
- Those who cannot work due to a disability
or
- Veterans with service-related disabilities
YOU MUST…
- Own your home
- Have occupied it as a primary residence at least 6 months out of the year
INCOME LIMIT
- $58,423 maximum annual household income in the previous year
WAYS TO APPLY
- Click here to apply online
- Call 206-296-3920
- Ask your local senior center if they help with applications
Senior/Disabled Property Tax Deferral
WHAT IS IT?
The ability for seniors & disabled people to defer unpaid property tax/special assessments, including back taxes for as long as you’ve owned the home. Deferred taxes + any accumulated interest then become a lien on the property until it’s repaid.
WHO QUALIFIES?
- Seniors age 60+
or
- Those who cannot work due to a physical disability
YOU MUST…
- Own your home and have lived in it for more than 9 months in a calendar year
- Meet an equity requirement
INCOME LIMIT
- $67,411 maximum annual household disposable income
HOW TO APPLY
- Call 206-263-2338
MORE TAX RELIEF PROGRAMS…
Limited Income Deferral
WHAT IS IT?
The ability to defer the second installment of your property taxes/special assessments (normally due October 31st) if you are a low-income homeowner. The deferred taxes plus interest become a lien on the property until they’re repaid.
YOU MUST…
- Have owned your property for 5 years
- Be living in the home as of January 1st of the application year AND more than 9 months during that year
- Meet an equity retirement
- Have already paid the first half of your taxes (due April 30th)
INCOME LIMIT
- $57,000 maximum annual household income in the previous year
HOW TO APPLY
- Call 206-263-2338
Homeowner Improvement Exemption
WHAT IS IT?
Relief from tax increases caused by major additions or remodels.
YOU MUST…
- Own a detached single family dwelling (including mobile homes)
- File your claim for exemption with the assessor BEFORE construction is complete
HOW TO APPLY
- Call 206-263-2338
Flood & Storm Damage Property Tax Reduction
WHAT IS IT?
Tax relief for property damaged by something beyond the owner’s control. Eligible properties receive a reduction of assessed value resulting in lower property taxes. In addition, taxpayers can receive an exemption to keep taxes lower for the 3 years after they rebuild.
YOU MUST…
- Have your property on the assessment roll as of January 1st in the year it was damaged
- Have property that was destroyed, OR was in a declared disaster area and reduced in value by more than 20% as a result of the disaster
HOW TO APPLY
- Complete a Destroyed Property Claim Form and file it with King County Dept of Assessments within 3 years of the damaging event
- Call 206-263-2332 with questions
For more information on any of these programs, visit the King County Assessor’s tax relief page. You can also find info for other counties on the WA Dept of Revenue website.

We earn the trust and loyalty of our brokers and clients by doing real estate exceptionally well. The leader in our market, we deliver client-focused service in an authentic, collaborative, and transparent manner and with the unmatched knowledge and expertise that comes from decades of experience.
© Copyright 2023, Windermere Real Estate/Mercer Island.
How’s the Market? Annual Review of Seattle Area Real Estate

While 2022 began on the heels of an extreme seller’s market we saw in the wake of the COVID pandemic, the second half of the year showed a marked shift back toward normalcy. Rising interest rates and tech layoffs significantly slowed down the number of home sales. The good news for buyers is that we finally saw a rise in the number of homes for sale (although we’re still not back up to our pre-pandemic inventory level).
Our Chief Economist, Matthew Gardner, predicts that median home prices will continue to pull back from their 2022 spike, but will then resume a more normal level of appreciation once interest rates stabilize. You can find his full forecast here.
Click or scroll down to find your area report:
Seattle | Eastside | Mercer Island | Condos | Waterfront
SEATTLE
The Seattle real estate market seems to be out to prove the old “tortoise and the hare” fable. The tale the numbers are telling is that when you don’t boom big, you’re likely not to bust big. 2022 was a year of steady growth and a lot less fear than in surrounding cities.
On average in a 2022 total look back, Seattle’s median price was up 10% (to $940,000) over $852,000 in 2021. Most of this gain was realized in the first half of the year, and unfortunately eroded in the second half of the year—when combined, it paints a fairly clear picture that we’re back to a “normal” market coming into 2023.
Queen Anne-Magnolia (up 17%), West Seattle (up 14%) and the Central District (up 13%) all fared better than average. Kenmore hung in at a 6% gain, which, given the volatility of interest rates and speculation, is still a respectable number for the year!
The headline for this year is that overall transaction volume was down in a big way. In Seattle, there were a total of 8,173 homes that sold; this is down 30% from the 11,670 sales we saw the year before. The slower market is not, however, creating a climate of fear where homeowners jump to cash out at the peak. New listings for the year were down a total of 13%.
We’ll be watching closely in 2023. If consumer confidence builds with the stabilization of interest rates, we’re going to have an even larger inventory crisis than we’ve faced in years past.
Click here for the full report and neighborhood-by-neighborhood statistics!

EASTSIDE
Finally, it’s safe to say that balance and normalcy have returned to the Eastside real estate market. The irony is: now that we’re in a balanced market, which is what homebuyers have purported to crave for a long time, the buyer’s appetite to purchase has all but dried up; overall transaction volume was down 36% in 2022 (5,448 sales vs. 8,569 in 2021).
If any of you are considering a move in the next 5 years, NOW is the time. The pendulum has swung back in the buyer’s favor: home inspections, negotiations and contingencies are all prevalent. We may not be at the exact “bottom” of pricing, but interest rates have stabilized, there are good homes for sale, and competition amongst buyers is rare. This is IT!
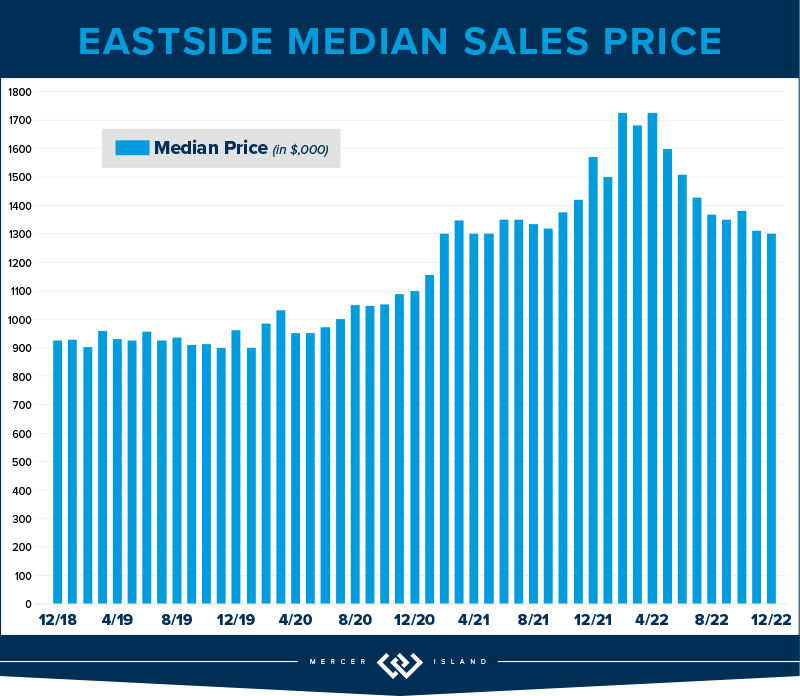
The Eastside’s Median Sale Price was $1,525,000 in 2022, up 14% over 2021’s unbelievable 30%+ gain ($1,350,000). Woodinville rules the day at a 17% rise, followed closely by Mercer Island (+16%) and Bellevue (both East and West at +15%).
While the market is slower paced, we are not in dire straits. This is thanks to a continued lack of inventory (down 5% YOY), and the amount of equity built in 2020 and 2021. Home sellers will spend the year working to determine the best way to attract a buyer. Price, preparation and timing will all play an important role. Home shoppers are sure to revel in their day in the sun!
Click here for the full report and neighborhood-by-neighborhood statistics!
MERCER ISLAND
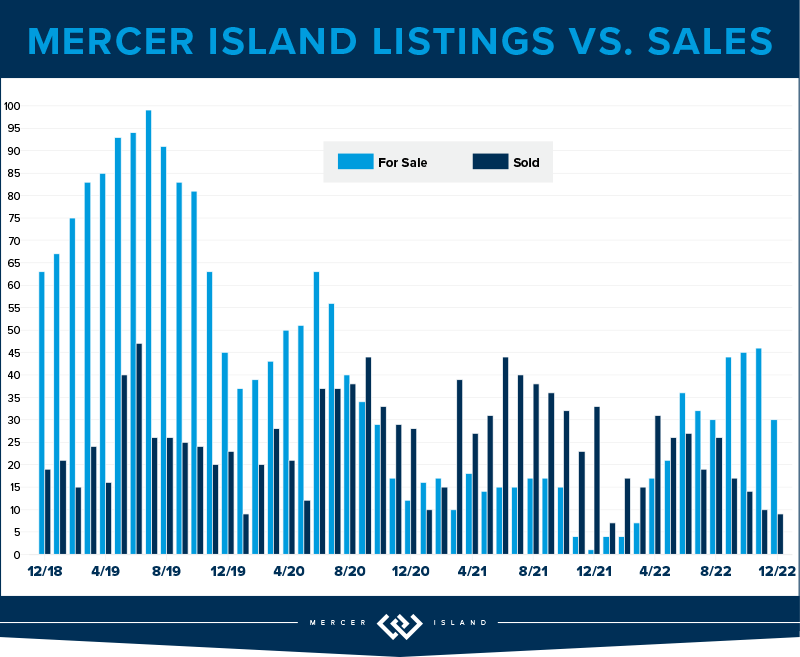
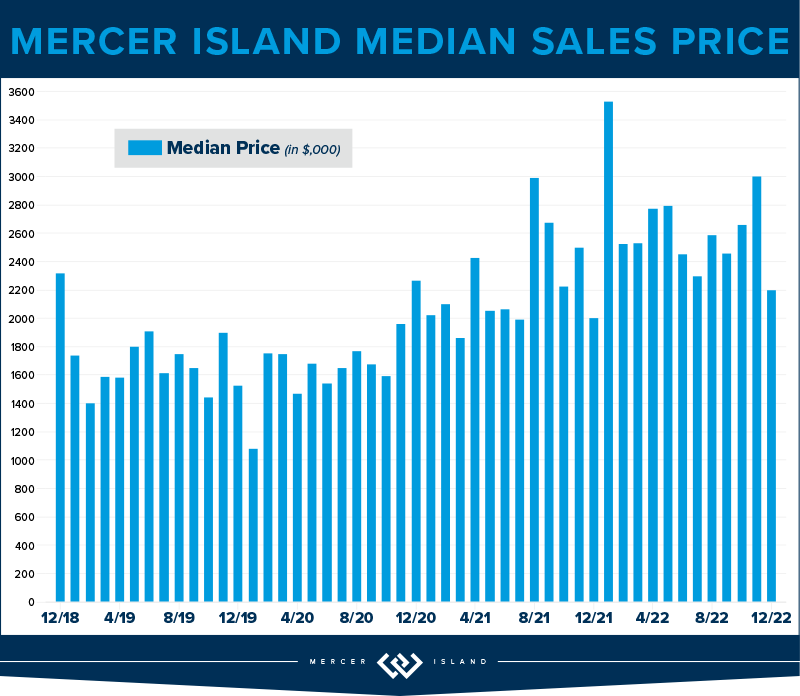
Mercer Island was once again its own unique micro-market within the Pacific Northwest. Total sales volume was only 209 homes, down 46% from 2021. This means that of nearly 10,000 households on the Island, only 2% purchased/sold a home.
The pace of sales was affected not only by interest rate volatility but also by the local tech economy/job market. The median home price nevertheless held strong with a 16% rise over 2021, even with the price correction that we all started to feel mid-year.
Buyers have decided to sit on the sidelines while it all shakes out, but home-owners on Mercer Island are not running for the hills. They’re patiently waiting (often without adjusting their asking prices) for the demand to return. It seems to be working: the median list price to median sales price ratio ROSE in 2022 from 77% to 88%.
2023 should be a solid year for Mercer Island real estate. All the pieces are in place: community pride, great schools and easy transportation. Let’s see if the upward trend continues!
Click here for the full report and neighborhood-by-neighborhood statistics!
CONDOS – SEATTLE & EASTSIDE
Seattle condos saw a Median Sale Price increase of 6% (to $520,000) and Eastside condos saw a 13% increase (to $620,000) in 2022. 53% of Seattle condos and 67% of Eastside condos sold in the first ten days on the market. This growth is larger than what we saw in 2021, which hopefully is some good news to anyone thinking of selling a condo in 2023. It seems that demand for urban living may be returning.
66% of Seattle condos and 77% of Eastside condos sold at or above their listed price. Those listings that sold in the first 10 days on the market went for an average of 1% and 4% above their list price, respectively..
On the Seattle side, Shoreline and Lake Forest Park condos saw about a 20% increase—and on the Eastside, Sammamish and East Bellevue condos carried the day with 19% and 23% increases—in Median Sale Price.
Overall, condos get our award for “ones to watch.” They remain a bright spot in terms of affordability when compared to single family homes, especially on the Eastside. Compare the $620,000 median sale price of a condo to the $1,525,000 median home price and it’s clear condos are a great first rung of the property ladder that might get attention in 2023.
Check out area-by-area details the full condo report.
WATERFRONT
There were 93 privately-owned waterfront home sales in the greater Seattle-Eastside region in 2022 (Eastside-32; Seattle-36; Lake Sammamish-15; Mercer Island-10). This is down significantly from the banner year in 2021 when we saw a whopping 170 total sales.
This truly is a market with geographic limitations. With such a high volume of sales in 2021 and a relatively strong 2022, we expect 2023 to be more conservative. Our late-2022 market shift from an extreme seller’s market to a more balanced level of supply and demand coincided with the close of the waterfront selling season. This means pricing will be tricky this season as we explore uncharted waters. More than ever, real estate experts will be essential to analyze the data and consult their spidey-senses to find the price that will attract a buyer in this new normal.
This brief overview of the entire Seattle-Eastside private waterfront market, including Mercer Island and Lake Sammamish, illustrates the trends occurring in our region over time. This data is interesting and insightful but cannot replace an in-depth waterfront analysis with your trusted professional.
© Copyright 2023, Windermere Real Estate/Mercer Island. Information and statistics derived from Northwest Multiple Listing Service and Trendgraphix, and deemed accurate but not guaranteed.
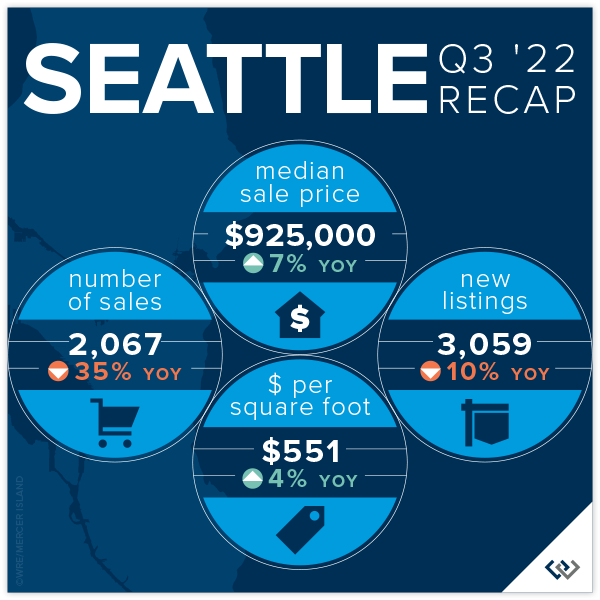
How’s the Market? Q3 2022 Real Estate Review

While still considered a seller’s market, our July-September home sale activity signaled the return of some much-needed balance. Seattle and Eastside home prices still posted year-over-year gains in Q3, but rising interest rates markedly slowed the pace of both listings and sales. Houses also stayed on the market longer than we saw during the frenzy earlier this year—the average Seattle home took 17 days to sell, while Eastside homes averaged 25 days to sell. Buyers have a great opportunity to negotiate better terms now with an eye out to refinance when interest rates come down in the future.
Click or scroll down to find your area report:
Seattle | Eastside | Mercer Island | Condos | Waterfront
SEATTLE
There is a lot of good news in Seattle these days: Progress is being made in taking back downtown, the West Seattle Bridge is open AND real estate prices are UP year over year.
Transaction volume is down 35% across the city, which we can likely attribute to the volatility in interest rates, but listing volume is also down 10%. This is comforting! Supply and demand rules the market, and the last thing this balancing market needs is more inventory. We think this drop in seller enthusiasm is likely caused by the golden handcuffs of their historically low interest rates and refinance boom: even if your home isn’t meeting your needs these days, that 2.75% interest rate might be hard to give up.
Seattle’s average list/sold price ratio is 97%. This means if you listed your home for $1,000,000 you could expect to sell for $970,000 in Q3 of this year. Compare this with 82% on the Eastside. Seattle home sellers are more realistic and less affected by the price bloat of the last several years. We didn’t boom as hard, and we may not feel the impacts of a market balance as sharply either.
Click here for the full report and neighborhood-by-neighborhood statistics!

EASTSIDE
While we’re finally seeing the numbers reflect what the market has been feeling since May, it’s not as dire as one might think. Sales volume has slowed 38% year over year (based on total transaction count). However, new listings are also down (3%) which means the market reaching its peak has not sparked a sell off. This should keep our new normal buzzing along at pace similar to 2018 and 2019. Great homes that are priced right will sell—21% of homes sold above asking price and 40% of homes sold in the first 10 days.
Median list price is down 6% while median sales price is down 14.5%, which means homeowners looking to sell on the Eastside now have some data points to help them with realistic expectations of how to find the market. Average days on market is 25, which is higher than it’s been since Q1 of 2020! This is still slightly under the 6-year average. Don’t be tempted to think that there is something wrong with a home just because it has been on the market for a month; there are a lot of quality homes ready for their new owners.
The news of the day is interest rates. Heavy volatility in the markets and the administration’s drive to stem inflation have caused many buyers to pull out of the market. If you’re thinking you’ll wait for lower rates AND lower prices, you might be dreaming—if rates come down next year as predicted it will likely spur activity on. Our best advice: THIS is the market you’ve been waiting for. As a buyer you have choice, time and negotiating power for the first time since 2018. Capitalize! Then, refinance later.
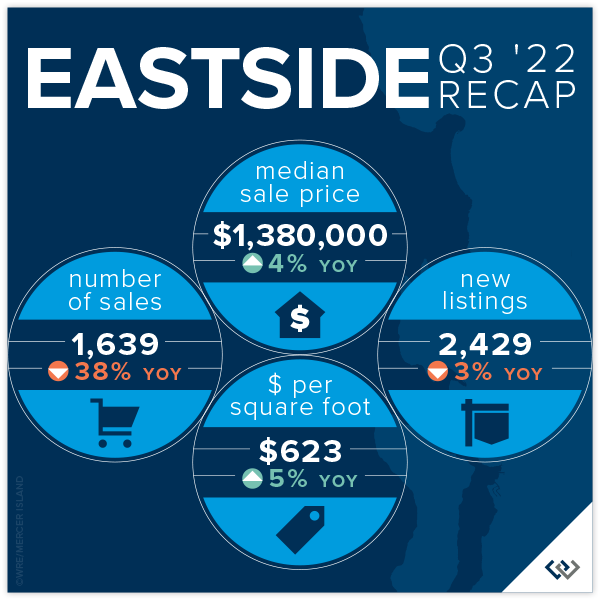
Click here for the full report and neighborhood-by-neighborhood statistics!

MERCER ISLAND
Given the broader local news, we might expect doom and gloom from Q3 stats—this expert sees lots of opportunity and much needed stabilization after the crazy COVID boom. While median prices have fallen 1% year over year, the average price per square foot is actually UP. What does this mean? Comparing a median with an average is always a little tricky, but this likely points to a slowdown in the sale of larger homes.
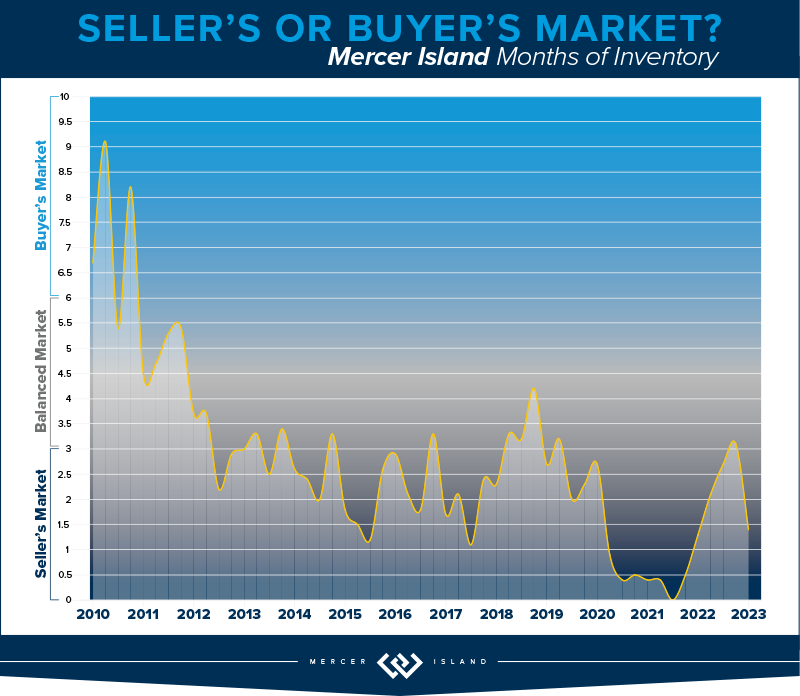
To me, the better signs of market predictability are the months supply of inventory for the quarter (about 6 weeks for both condos and single family) and the average days on market (18 for sf and 57 for condo). These are all relatively healthy benchmarks, even though they’re markedly higher than in previous quarters. This is what’s causing media to report doom and gloom: inventory is up sharply (there was ONE active listing at the end of Q4 2021 vs 44 at the end of Q3 2022) and pending sales are down (57 vs. 94 last year in the same time period). When you compare our current numbers to any time period outside of the last two years, we’re faring very well!
The news of the day is interest rates. Heavy volatility in the markets and the administration’s drive to stem inflation have caused many buyers to pull out of the market. If you’re thinking you’ll wait for lower rates AND lower prices, you might be dreaming—if rates come down next year as predicted it will likely spur activity on. Our best advice: THIS is the market you’ve been waiting for. As a buyer you have choice, time and negotiating power for the first time since 2018. Capitalize! Then, refinance later.
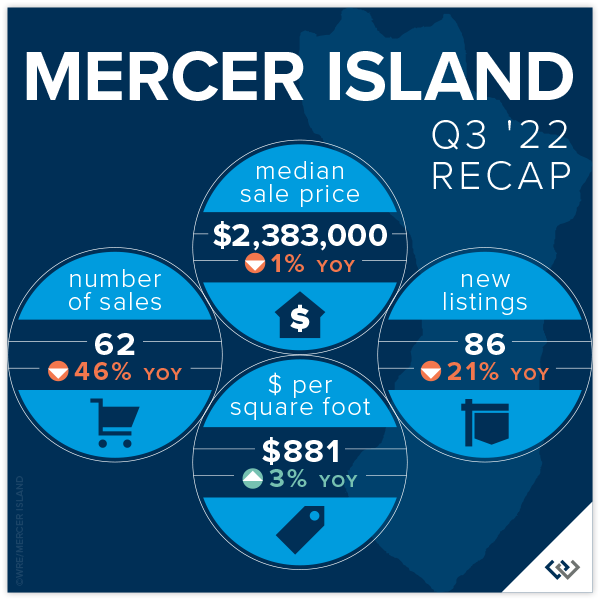
Click here for the full report and neighborhood-by-neighborhood statistics!

CONDOS – SEATTLE & EASTSIDE
Condos remain the tortoise as opposed to the hare like residential markets of 2020-early 2022. Slow and steady will definitely win this race as the affordability of homeownership shrinks with rising interest rates. Looking at combined condo data (Eastside + Seattle), months supply of inventory is down to about 6 weeks from 2 months last quarter. Low months supply of inventory and low cumulative days on market (23) are two of the leading indicators of market health, and both are as low or lower as they’ve been in the recent past.
Condo prices are also holding strong with no change to the average $ per square foot in Seattle and an overall 5% rise in median sale price year over year. The Eastside tells an even slightly better story: a 9% rise in $ per square foot and a 6% rise in median sale price despite a 41% year-over-year drop in the number of transactions.
Keep rooting for the tortoise. This is a necessary niche in our marketplace. The first rung on the property ladder is condos again for the first time in a long time, and we really hope our Gen Z and Millennial buyers take the leap!
Check out area-by-area details the full condo report.

WATERFRONT
The most affordable place to buy waterfront this quarter was Beach Dr in West Seattle at a closed sale price of $1,800,000 for 22’ of waterfront on an 11,000 sq. ft. lot. The largest piece of shoreline overall was 172 feet in Medina on Lake Washington, which commanded a sales price of $17,800,000.
This brief overview of the entire Seattle-Eastside private waterfront market, including Mercer Island and Lake Sammamish, illustrates the trends occurring in our region over time. This data is interesting and insightful but cannot replace an in-depth waterfront analysis provided by a savvy broker with years of local waterfront experience.

We earn the trust and loyalty of our brokers and clients by doing real estate exceptionally well. The leader in our market, we deliver client-focused service in an authentic, collaborative, and transparent manner and with the unmatched knowledge and expertise that comes from decades of experience.
© Copyright 2022, Windermere Real Estate/Mercer Island. Information and statistics derived from Northwest Multiple Listing Service and deemed accurate but not guaranteed.
Kicks for Kids Shoe Drive August 8-19

Help us give kids the confidence they need to start the school year right! Windermere Mercer Island invites you to participate in our Kicks for Kids back-to-school sneaker drive. It connects low-income youth in our local communities with new shoes for the upcoming school year. Between August 8th and 19th, we’ll be accepting donations two ways:
-
Bring new or gently used sneakers (toddler/youth sizes) to my office at 2737 77th Ave SE, Ste. 100, Mercer Island. We’ll enter your name into a raffle for a delectable prize from Island Treats, and we’ll also match the first 100 pairs of shoes donated!
-
Shop from our Amazon Wishlist.
This year, we’re partnering once again with the Eastside Baby Corner, an amazing organization that helps kids thrive by providing resources and essentials with their 70+ partner agencies—many of which are school districts.
Help us make sure every child has a new pair of shoes for school!

We earn the trust and loyalty of our brokers and clients by doing real estate exceptionally well. The leader in our market, we deliver client-focused service in an authentic, collaborative, and transparent manner and with the unmatched knowledge and expertise that comes from decades of experience.
2737 77th Ave SE, Mercer Island, WA 98040 | (206) 232-0446
mercerisland@windermere.com
© Copyright 2022 Windermere Mercer Island
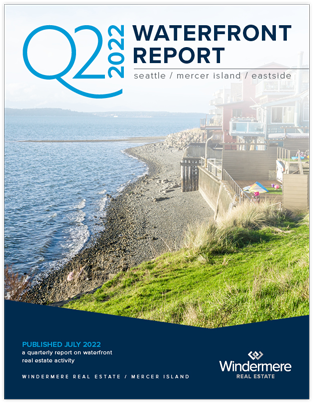
How’s the Market? Q2 Real Estate Review

While Seattle and the Eastside are still considered a seller’s market, buyers experienced some much-needed relief in the second quarter with new listings outpacing the number of homes sold. Rising interest rates have initiated a shift toward a more balanced market. Opportunities abound for both sellers (who are still seeing higher sales prices than this time last year) and buyers (who finally have some breathing room to negotiate price and contingencies). We expect this shift to continue with a stabilization of home prices rather than the steep upward trajectory we saw last year.
Click or scroll down to find your area report:
Seattle | Eastside | Mercer Island | Condos | Waterfront
SEATTLE
The Seattle real estate market for single family homes is holding steady despite rising interest rates and slowdowns elsewhere in King County! The median sale price is up 9% since the end of 2021 (from $910,000 to $1,000,000). Year over year, the median price rose from $895,000 in Q2 2021 to $1,000,000 in Q2 2022 (also roughly 12%).
Anecdotally, we believe that Seattle continues to gain ground because it remains affordable when compared to the cities and neighborhoods to the east. Eastside median prices rose so sharply over the last two years that it left Seattle “in the dust” as the market leader of the region. As we know, slow and steady wins the race, though there is no way to know yet if this particular race is a marathon or a sprint.
Interest rates nearly doubled in Q2, though that seems to leave Seattle home shoppers undeterred. 86% of the sales in Q2 sold in the first 10 days at an average of 110% of list price.
Click here for the full report and neighborhood-by-neighborhood statistics!

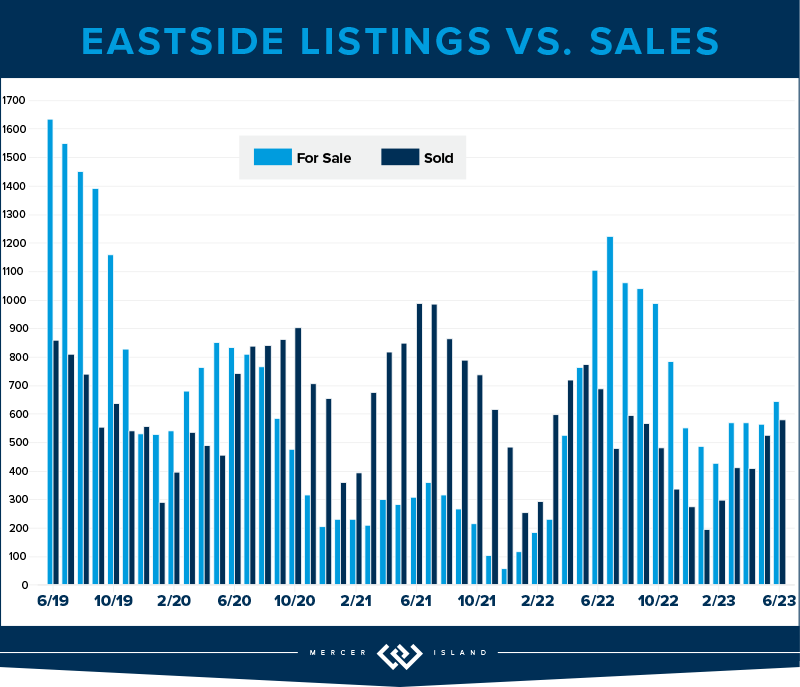
EASTSIDE
Relief has finally come to home shoppers on the Eastside! New listings are up 13% year over year. Further, there has been a slide in total number of sales, down 18% year over year. This means there are more choices for anyone who is in the market to buy a home. Price gains remain steady for now, up 22% over Q2 of 2021. This is likely riding the wave of growth in late 2021 and early 2022, but with the higher supply and lower demand this is may be a trend that tapers off in the near future.
Average price per square foot saw its first quarterly drop since Q2 of 2019, down from $713 in Q1 to $685. The overall median price fell from a high of $1,625,000 in Q1 to $1,610,000 in Q2. Even more exciting for home buyers is that (when in competition) the list to sales price ratio is 109%— down from 119% in Q1.
If you’ve thought about selling your home, it’s still a great time. When a home is prepared well and priced right shoppers pay attention. Of the 2177 homes sold in Q2, 84% of those sold in the first 10 days. This isn’t far off of the 90% that was posted in Q1. It is harder to get noticed today than in recent memory—this is where choosing a true professional to partner with is so important! Windermere brokers have their fingers on the pulse and know how to make you stand out in a crowd!

Click here for the full report and neighborhood-by-neighborhood statistics!

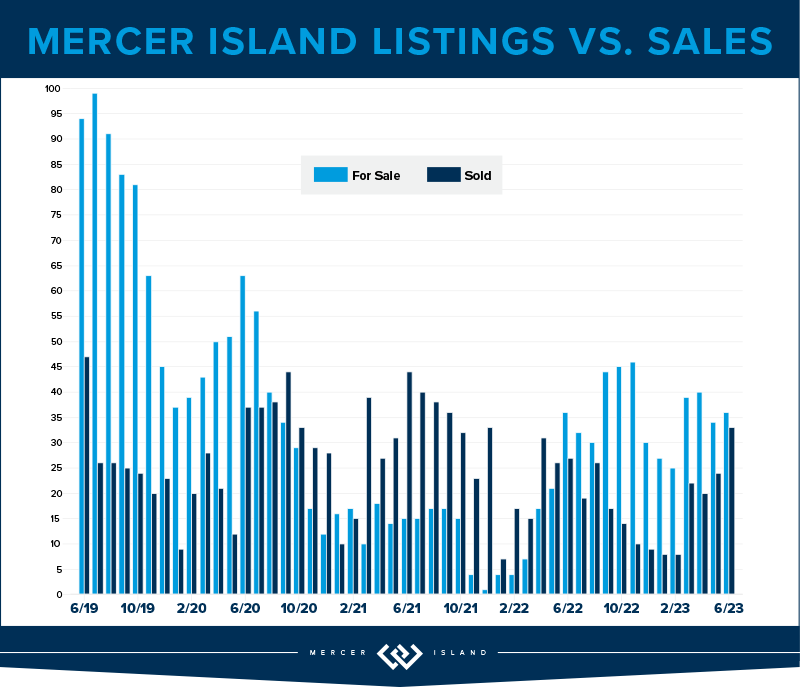
MERCER ISLAND
Mercer Island continues to be a fabulous place to be a homeowner. Median prices and price per square foot both saw increases over Q1 2022 numbers (6.5% and 5% respectively). Anecdotally, there has been a pace change. We don’t expect that to reflect in the stats until Q3, and even then the numbers are likely to be favorable as we gained so much ground in Q1 of this year.
The data that supports what we’re all feeling can be found in the relationship between number of new listings and number of homes sold. In Q2, there were 116 new listings and 84 sales compared to the same period in 2021 when we had 124 new listings and 102 sales. So, if you’re feeling like inventory is “up,” it’s not because more homeowners are deciding to sell but rather it appears that demand is down. Another way to look at this is that we sold 82% of the active inventory in spring of 2021 but only 72% in 2022. These are healthy numbers but it’s enough of a drop for us to feel it.
If you’re a buyer trying to break in to the Mercer Island market, it’s getting easier. 83% of the 116 new listings sold within the first 10 days for an average of 111% of the asking price. This is the most favorable these numbers have been since 2019. Working with a local pro will be your biggest advantage to determine which homes will sell at a premium and how to get the best deal!

Click here for the full report and neighborhood-by-neighborhood statistics!

CONDOS – SEATTLE & EASTSIDE
Condo average prices have seen their biggest quarterly rise since Q3 of 2016! As home shoppers adjust expectations amidst rising interest rates, the affordability offered by condos is an exciting place to turn. We are thrilled to see condos be a viable option as we recover from the pandemic and buyers return to more densely populated areas.
North Seattle (up 34%) and Capitol Hill (up 10%) are bright spots in the total number of condos sold year over year for Seattle. This makes perfect sense as both areas offer access to our growing light rail system and new retail opportunities that didn’t exist pre-pandemic. Seattle’s total sales year over year remained flat, literally zero, which means these two neighborhoods carried the entire city.
The same data point on the Eastside saw the entire area’s total number of sales fall 27% year over year. West Bellevue (down 51%) and Mercer Island (down 38%) topped the list. Meanwhile, prices on the Eastside are up an average of 20%.
Check out area-by-area details the full condo report.
WATERFRONT
Waterfront season is heating up. As expected, inventory is up from Q1 (32 total sales in Q2 v 17 in Q1), but what hasn’t changed is an average of only 6 listings for sale at any one time across all shorelines! Of all of the waterfront shorelines, Mercer Island boasted the lowest days on market with an average of just THREE days. Seattle had the highest days on market, with an average of 41 days.
The most affordable place to buy waterfront this quarter was Beach Dr in West Seattle at a closed sale price of $1,800,000 for 25’ of waterfront on a 17,000 sq. ft. lot. The largest piece of shoreline overall was 177 feet in Issaquah on Lake Sammamish, which commanded a sales price of $11,600,000.
This brief overview of the entire Seattle-Eastside private waterfront market, including Mercer Island and Lake Sammamish, illustrates the trends occurring in our region over time. This data is interesting and insightful but cannot replace an in-depth waterfront analysis provided by a savvy broker with years of local waterfront experience.
We earn the trust and loyalty of our brokers and clients by doing real estate exceptionally well. The leader in our market, we deliver client-focused service in an authentic, collaborative, and transparent manner and with the unmatched knowledge and expertise that comes from decades of experience.
© Copyright 2022, Windermere Real Estate/Mercer Island. Information and statistics derived from Northwest Multiple Listing Service and deemed accurate but not guaranteed.
